Brace Map Template
Elevate your brainstorming and planning with the brace map template.
Trusted by 65M+ users and leading companies


About the Brace Map Template
The brace map template helps you organize, analyze, and visualize complex ideas in a clear and structured manner. Whether you're brainstorming, planning projects, or teaching concepts, the brace map provides an adaptable workspace for your thoughts to grow.
What's the brace map template?
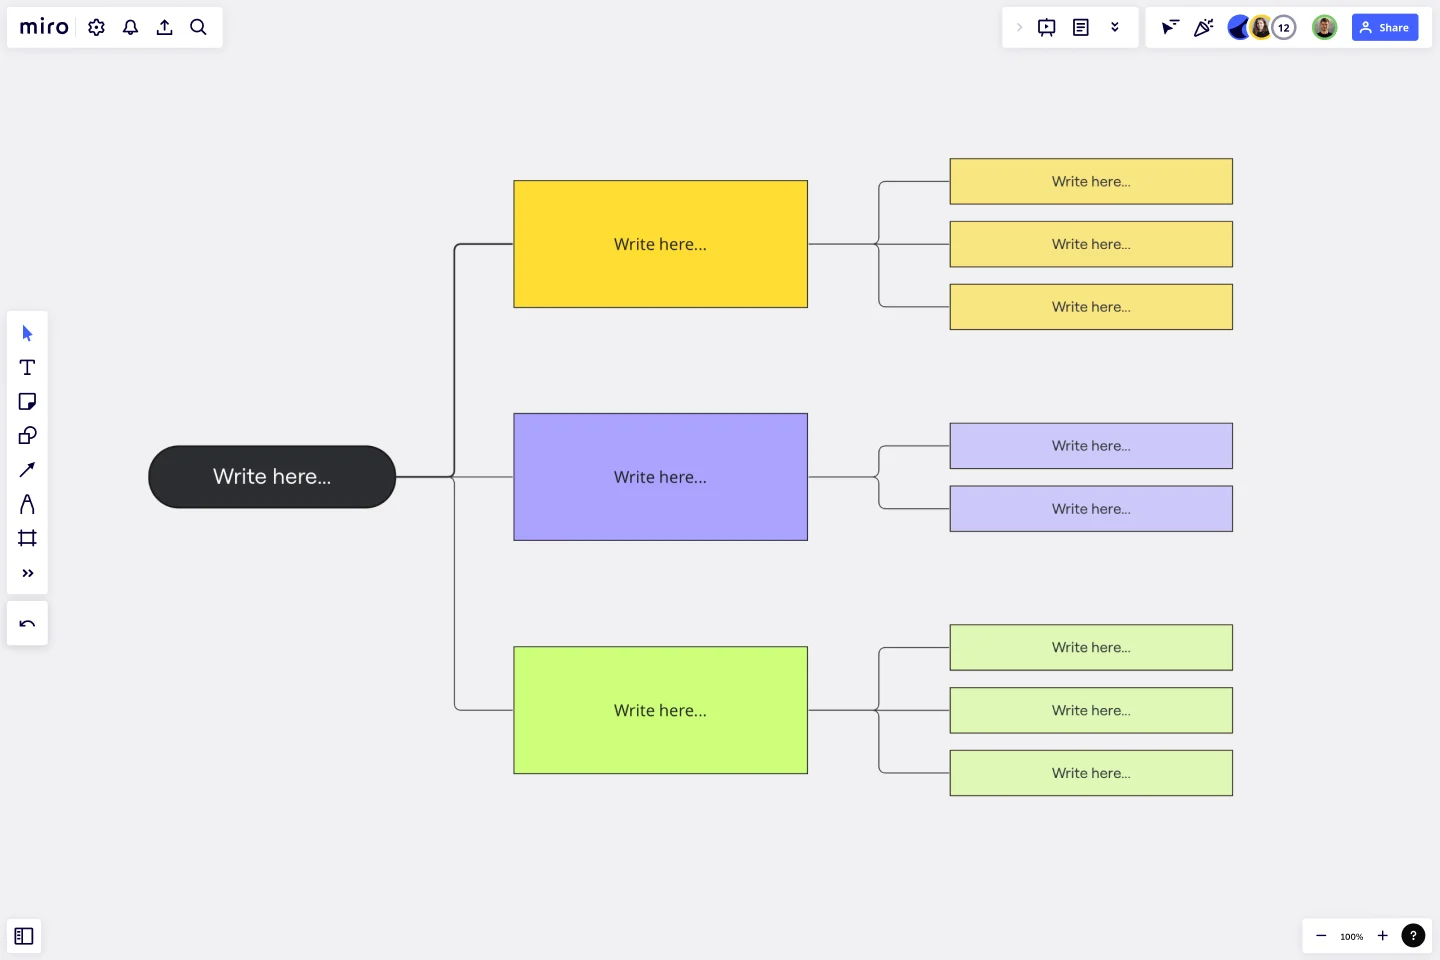
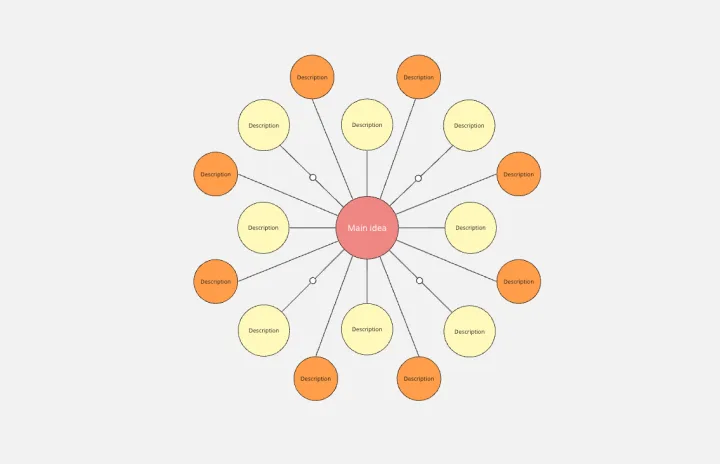
The brace map template is a tool that helps users analyze complex ideas by breaking them down into smaller, more manageable components. This template consists of a central concept or idea connected to supporting sub-elements through braces, forming a hierarchical structure, like a mind map. Each "brace" represents an association or relationship between the central concept and its supporting elements.
The template is divided into several key areas that allow users to organize their thoughts, including:
Central concept: This is the core idea you want to explore or analyze.
Main brace: The primary connection extends from the central concept, symbolizing the main category or theme.
Sub-braces: These extend from the main brace, representing sub-categories or supporting details.
Text boxes: Add detailed information or descriptions to each brace, providing clarity and context.
How to use the brace map template in Miro?
Edit easily: Customize the central concept, main brace, and sub-braces by simply clicking on them. Edit text, colors, and shapes effortlessly.
Expand automatically: Easily expand your brace map with a single click, allowing you to dive deeper into sub-categories and create a comprehensive visual representation.
Add context: Enhance your map by adding artifacts like images, links, or documents directly onto the Miro board, providing additional context and depth to your visualizations.
Why should you use a brace map template?
Clarity: Organize complex ideas into a structured format for enhanced clarity.
Visual hierarchy: Clearly define relationships and hierarchies between different elements.
Efficient communication: Streamline communication by presenting information in a visually digestible format.
Collaboration: Foster collaboration by creating a shared visual space for brainstorming and planning.
Dynamic exploration: Easily adapt and expand your thoughts as ideas evolve, keeping your visualizations dynamic and relevant.
Can I customize the colors and shapes of the braces in the brace map template?
Yes, click on the desired brace or element, and a menu will appear, allowing you to customize colors, shapes, and text.
How can I quickly expand the brace map with additional sub-braces?
Click on the expand button, and the brace map will dynamically grow, revealing space for additional sub-braces.
Is it possible to collaborate in real time on a brace map in Miro?
Certainly! Share your Miro board with collaborators; everyone can contribute in real time.
Can I export the brace map for external use or sharing?
Yes, Miro allows you to export your brace map in various formats, such as PDF or image files, making it easy to share your visualizations outside the platform.
Get started with this template right now.
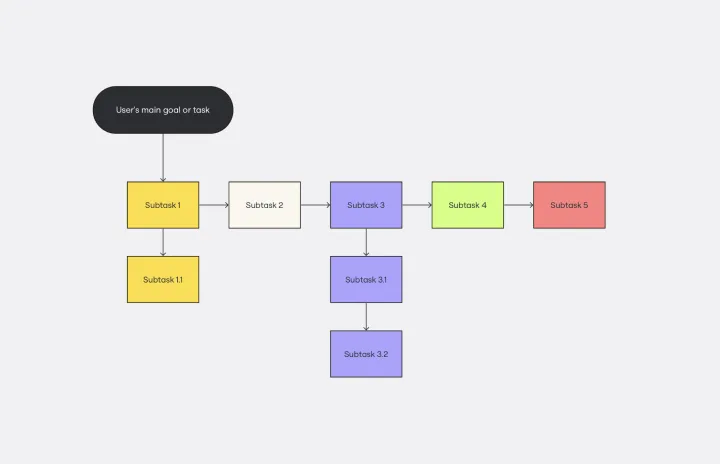
Task Analysis Diagram Template
Works best for:
Diagramming
The Task Analysis Diagram Template is a helpful tool that simplifies complex tasks by breaking them down into smaller, more manageable steps. This strategic approach brings clarity and ensures a systematic method for tackling complex user paths. The template's most significant advantage is its precision, as it maps out every detail of a task to guarantee that nothing is missed. This results in more efficient operations.
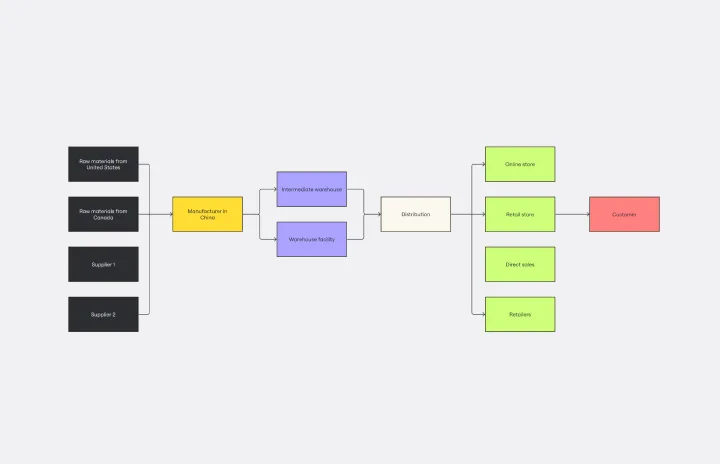
Supply Chain Diagram Template
Works best for:
Diagramming
The Supply Chain Diagram Template is great for businesses to streamline and enhance their supply chain processes. This template lets you visualize the entire supply chain, from sourcing raw materials to delivering finished products. Its intuitive layout simplifies complex networks, making identifying key areas and potential bottlenecks easier. One of the standout benefits of using this template is its clarity. It bridges the gap between complex processes and strategic decision-making by presenting a clear, visual supply chain representation. This clarity enables teams to pinpoint inefficiencies and implement more effective management strategies, which optimizes operations and facilitates better communication and understanding across different departments within an organization.
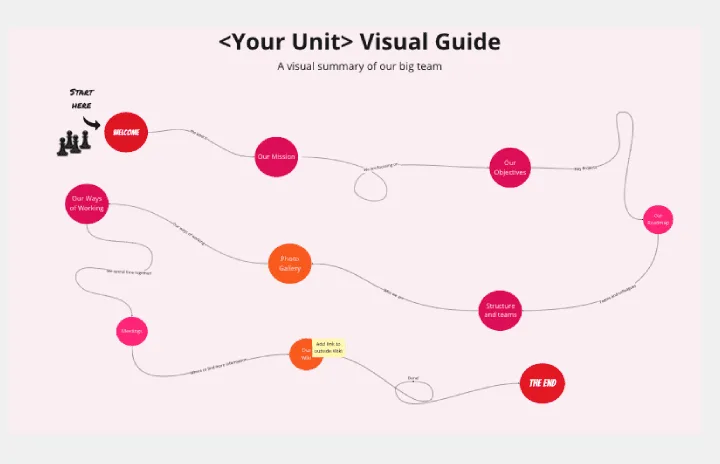
Org Unit Visual Guide
Works best for:
Org Charts, Operations, Mapping
Org Unit Visual Guide template offers a visual reference for understanding organizational units and their relationships. By mapping out departments, teams, and reporting lines, this template enhances clarity and transparency. With customizable features for adding annotations and descriptions, this template facilitates communication and alignment across organizational units.
Bubble Map Template
Works best for:
Diagramming, Mapping, Brainstorming
A Bubble Map Template is a visual organization tool that uses bubbles or circles to represent various ideas or data points. These bubbles are linked together, displaying their relationships and creating a network of interconnected thoughts. Use a Bubble Map Template to streamline complex information, enhancing comprehension and promoting efficient decision-making.
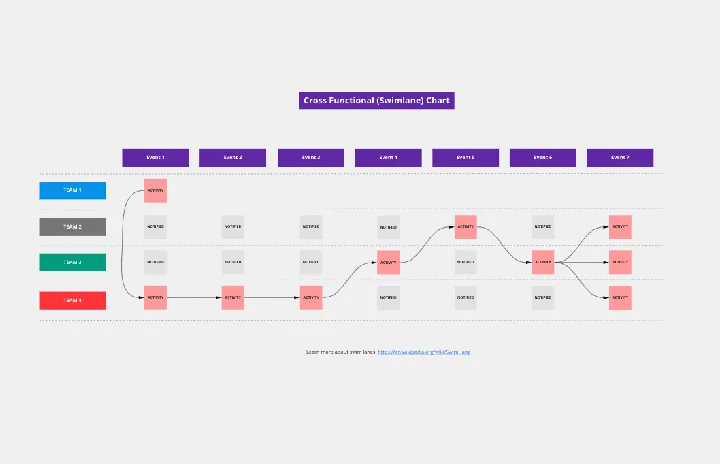
Cross Functional (Swimlane) Chart
Works best for:
Flowcharts, Mapping, Diagrams
The Cross Functional (Swimlane) Chart template offers a visual tool for mapping out processes or workflows with multiple stakeholders or functional areas. It provides swimlanes for organizing tasks and responsibilities by department or role. This template enables teams to visualize process flows, identify handoffs, and improve coordination and collaboration across functions. By promoting transparency and accountability, the Cross Functional (Swimlane) Chart empowers organizations to streamline workflows and drive cross-functional alignment effectively.
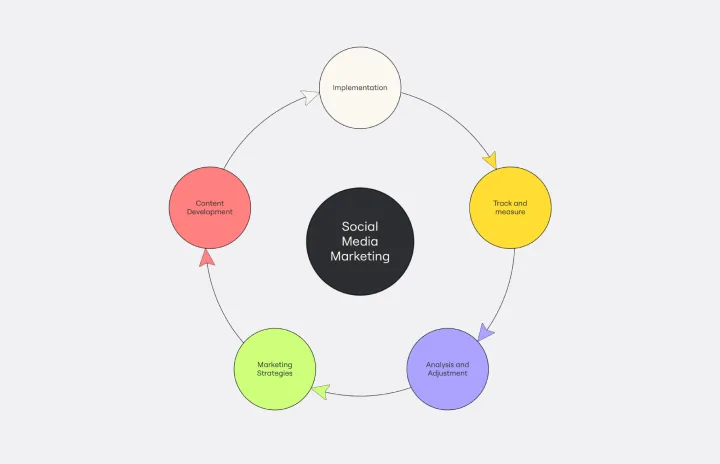
Cycle Diagram Template
Works best for:
Diagramming
The cycle diagram template empowers professionals to visually represent complex cycles with precision and clarity. This template maps out cyclical processes, relationships, or events, ensuring that complex concepts are communicated seamlessly. One key benefit that sets this template apart is its ability to streamline communication and enhance understanding. By crafting visually appealing cycle diagrams, professionals can distill complex information into a clear visual language, making it easier for teams and stakeholders to grasp complex relationships. This ultimately fosters more effective collaboration and decision-making.