Task Analysis Diagram Template
Analyze your user path by mapping out their tasks in a systematic way with the task analysis diagram template.
Trusted by 65M+ users and leading companies


About the Task Analysis Diagram Template
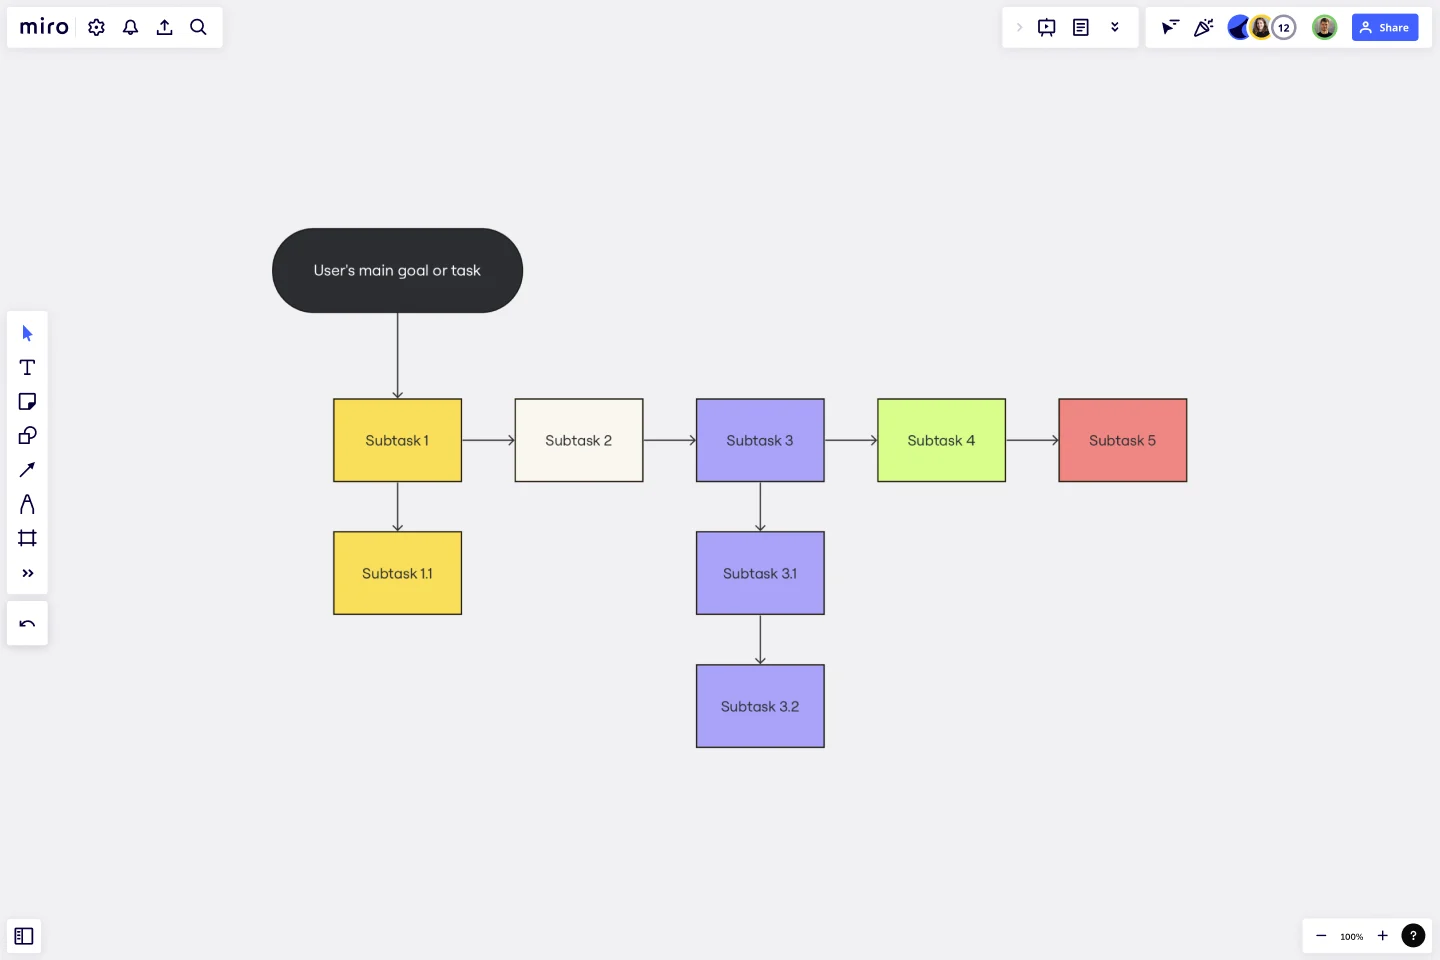
The task analysis diagram template is a visual tool that helps capture, organize, and categorize a user's tasks while interacting with a product. It is designed to break down user tasks and their interactions, making it easier to bridge the gap between planning and action. This template is perfect for anyone wanting to unravel a process's complexities and turn them into actionable steps.
The template presents each task in a sequential and hierarchical order, which makes it easier to understand the flow of the user's journey and identify dependencies and potential issues. It is like creating a map of the user's journey, where each step and action is detailed, ensuring a clear understanding of the entire process.
How do you use the task analysis diagram template?
Follow these four simple steps to get started:
Edit the template: Change the template to suit your needs with just a few clicks. You can add tasks, delete redundancies, or change the flow of the diagram. The template is designed to be user-friendly and easy to edit.
Expand: Need to expand the diagram? Miro’s automated diagramming features let you quickly add more shapes and connector lines while maintaining the diagram's structure.
Add contextual information: Make your diagram more comprehensive by adding relevant artifacts, such as documents, links, or images, for additional information.
Why should you use the task analysis diagram template?
Clear visualization: The template provides a clear, concise, and visual representation of all tasks and their interactions, making it easier to understand and follow than textual explanations.
Process identification: Using the template helps identify redundant tasks, potential bottlenecks, or gaps that might have been overlooked, which can be addressed to improve the overall process.
Enhanced collaboration: Team members can collaboratively view, discuss, and edit the diagram, ensuring everyone is on the same page and making it easier to work together.
User-centric design: Understanding the tasks a user undergoes helps design or change products to better suit user needs and preferences, resulting in better user experiences.
Structured approach: The template gives a structured approach to task analysis, ensuring no task or detail is overlooked and making the process more organized and efficient.
If you'd prefer to start from scratch, diagramming with Miro is easy! You can choose from a wide range of diagramming shapes in Miro's extensive library, so you'll find just what you need.
What if I need to add more tasks than the template provides?
No worries! The template is expandable. You can effortlessly add more shapes and connectors to accommodate additional tasks.
Can multiple team members collaborate on the same diagram?
Absolutely. The template is designed for collaborative efforts, ensuring multiple people can view, comment, or edit in real time.
Is there a way to integrate other information or links directly into the diagram?
Yes, you can seamlessly add any artifact onto the board, be it a document, image, or hyperlink, to provide richer context and information.
Get started with this template right now.
Fault Tree Analysis Template
Works best for:
Diagramming
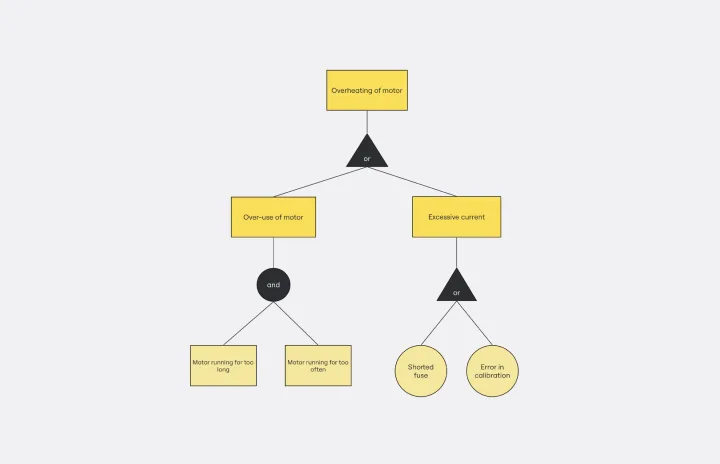
The Fault Tree Analysis Template visually breaks down potential system malfunctions, highlighting complex causal relationships between faults. One of its standout benefits is its ability to enhance clarity in complex scenarios, allowing professionals to swiftly pinpoint root causes and prioritize interventions, ensuring a more streamlined approach to problem-solving.
Workflow Diagram Template
Works best for:
Diagramming, Mapping, Process mapping
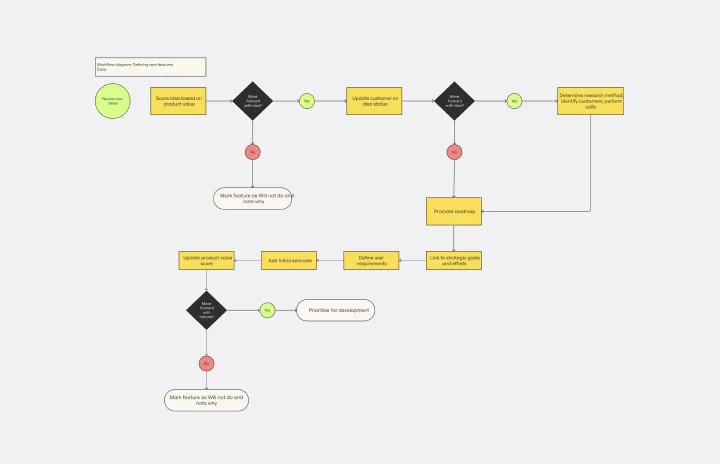
The Workflow Diagram Template maps out and represents processes or systems using standardized symbols and shapes. By delineating the various steps or stages in a process, it ensures that tasks flow seamlessly from initiation to completion. One of the standout benefits of using this template is its clarity. By translating processes into a visual format, all participants can gain a comprehensive understanding at a glance, eliminating confusion and ensuring everyone is on the same page. This clarity not only promotes efficient task execution but also fosters collaboration among team members.

Onion Diagram Template
Works best for:
Diagramming, Mapping and Diagramming
The Onion Diagram Template is a distinct tool designed to visually represent layers of a specific concept, system, or process, akin to the layers of an onion. Each concentric layer of the diagram provides insights into a different aspect or phase of the topic at hand, moving from the core foundational element outwards to more peripheral components. One of the prime benefits of this template is its ability to offer hierarchical clarity. Users can immediately discern the importance, sequence, or interrelation of different elements within a system, facilitating enhanced comprehension and efficient decision-making.

2-Circle Venn Diagram Template
The 2 Circle Venn Diagram Template is a dynamic, intuitive tool designed to represent the logical relationships between two data sets visually. For teams, this template proves valuable in enabling efficient collaboration, clear communication, and shared understanding.

Driver Diagram Template
Works best for:
Diagramming
The driver diagram template is a strategic visual tool that helps teams map out their primary objectives and break them down into actionable components. It presents goals, drivers, and specific change ideas in a coherent and interconnected format, ensuring clarity of objective. By doing so, every team member is aligned towards a common endpoint, fostering unified efforts. The visual nature of the template simplifies complex objectives, making it easier for teams to stay on track and measure their progress effectively.
Org Unit Visual Guide
Works best for:
Org Charts, Operations, Mapping
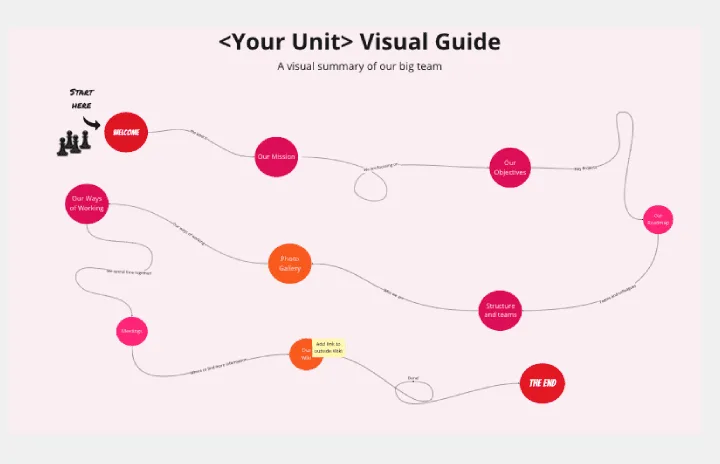
Org Unit Visual Guide template offers a visual reference for understanding organizational units and their relationships. By mapping out departments, teams, and reporting lines, this template enhances clarity and transparency. With customizable features for adding annotations and descriptions, this template facilitates communication and alignment across organizational units.