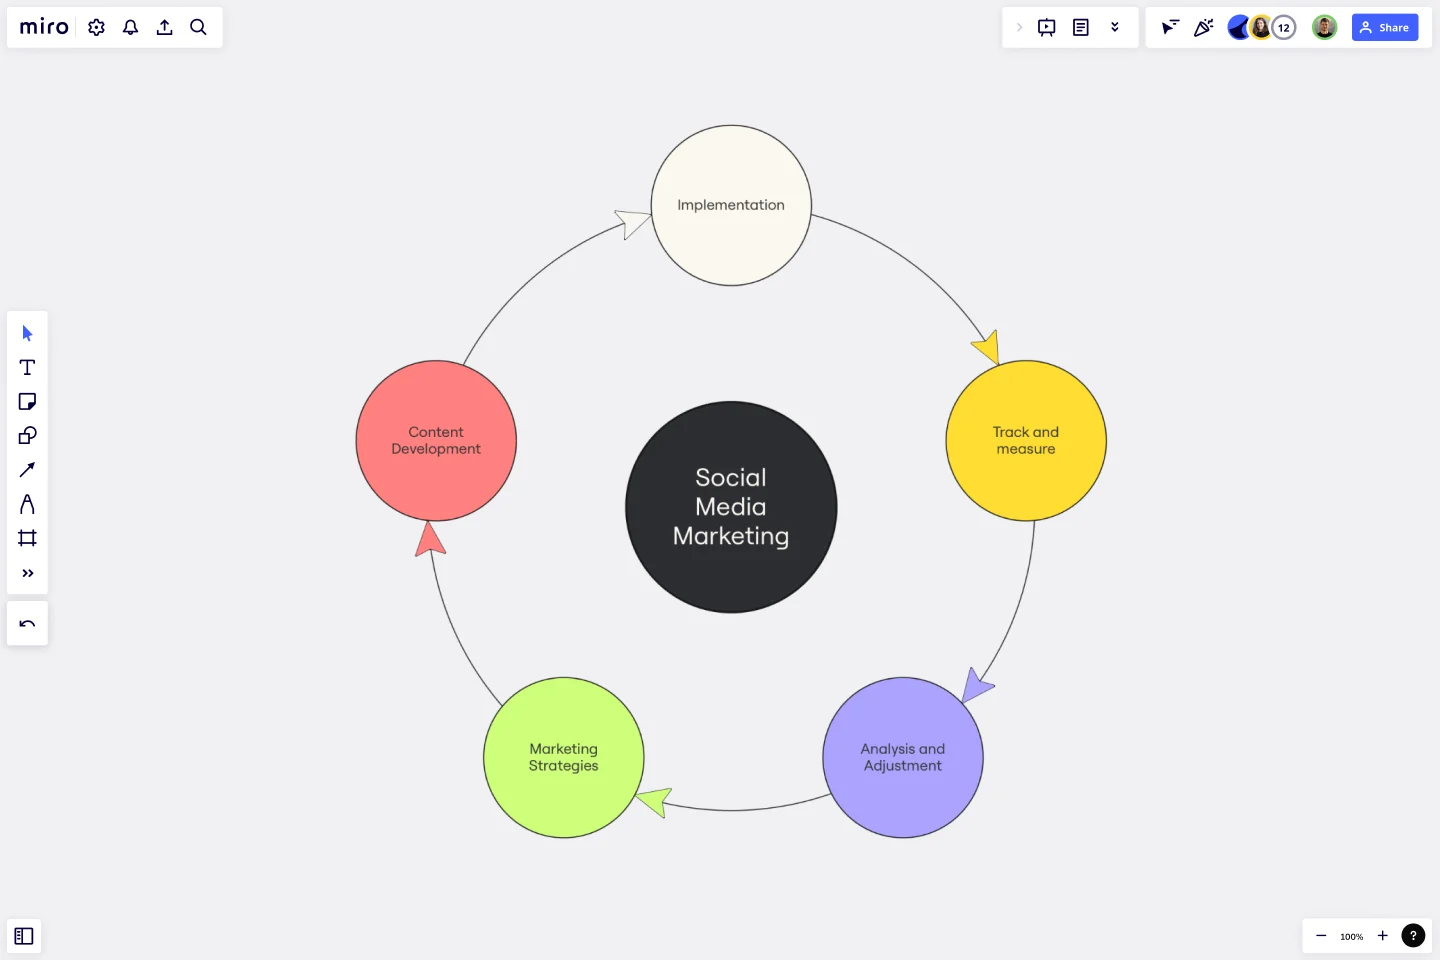
Cycle Diagram Template
Effortlessly represent complex cycles, enhance presentations, and collaborate seamlessly using the cycle diagram template.
Trusted by 65M+ users and leading companies


About the Cycle Diagram Template
The cycle diagram template helps you streamline visual communication by mapping project cycles, illustrating process flows, or visualizing interconnected concepts. With this template, you can create compelling and insightful diagrams that will help you communicate your ideas more effectively.
Understanding the cycle diagram template
Cycle diagrams are a great way to visually represent processes, relationships, or events in an organized manner. They provide a structure that easily depicts the continuous flow and interdependence of elements within a system. You can simplify complex concepts using cycle diagrams, making it an invaluable asset for anyone seeking clarity in their visual storytelling.
How to use the cycle diagram template in Miro
Customize with ease: Effortlessly edit the template by adding, removing, or rearranging elements with just a few clicks.
Automated diagramming: Leverage Miro's automated diagram maker to expand and enhance your cycle diagram. Connect elements seamlessly, allowing the diagram to evolve dynamically as your ideas take shape.
Contextual artifacts: Elevate your diagram by incorporating additional artifacts from your Miro board. Whether it's notes, images, or data, provide context that enriches the understanding of your audience.
Why should you use a cycle diagram template?
Clarity and understanding: The template promotes clarity, enabling you to communicate complex processes with simplicity.
Efficiency in visualization: Quickly map out cyclical relationships and processes, saving time and effort in creating visually impactful diagrams.
Collaborative advantage: Enhance collaboration by creating a shared visual language that fosters clear communication among team members.
Versatility: The template adapts to various contexts, making it suitable for project management, strategic planning, or educational purposes.
Professional Presentation: Elevate your presentations and reports with professionally crafted cycle diagrams that resonate with your audience.
Can I change the colors and styles of the cycle diagram template?
Achieve your desired look by customizing the template with ease. Adjust colors, fonts, and styles by selecting shapes and editing in the context menu bar.
Can I export the cycle diagram to other formats?
Yes, Miro allows you to export your cycle diagram in various formats, ensuring compatibility with your preferred tools and platforms.
Get started with this template right now.
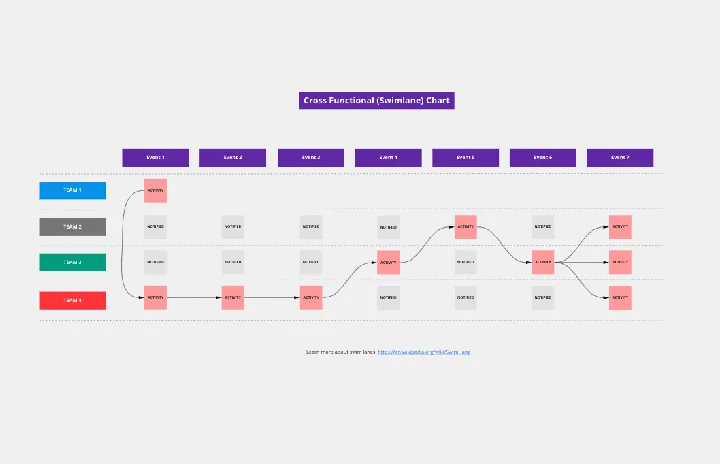
Cross Functional (Swimlane) Chart
Works best for:
Flowcharts, Mapping, Diagrams
The Cross Functional (Swimlane) Chart template offers a visual tool for mapping out processes or workflows with multiple stakeholders or functional areas. It provides swimlanes for organizing tasks and responsibilities by department or role. This template enables teams to visualize process flows, identify handoffs, and improve coordination and collaboration across functions. By promoting transparency and accountability, the Cross Functional (Swimlane) Chart empowers organizations to streamline workflows and drive cross-functional alignment effectively.

2-Circle Venn Diagram Template
The 2 Circle Venn Diagram Template is a dynamic, intuitive tool designed to represent the logical relationships between two data sets visually. For teams, this template proves valuable in enabling efficient collaboration, clear communication, and shared understanding.
SDLC Template
Works best for:
Diagramming
The Software Development Life Cycle (SDLC) template is a well-designed visual tool that helps software development teams follow a structured approach from the initial concept to the final deployment of the software. One of the most significant benefits of using this template is that it promotes clear, streamlined communication among team members. By breaking the development cycle into distinct phases, all stakeholders can stay informed about the progress of the project and understand their responsibilities within the larger context. This enhanced communication reduces the chances of misunderstandings and ensures that everyone works together towards the common goal of delivering high-quality software. The template acts not only as a roadmap but also as a shared language for the team, improving collaboration and the efficient progression of the project through each critical stage.
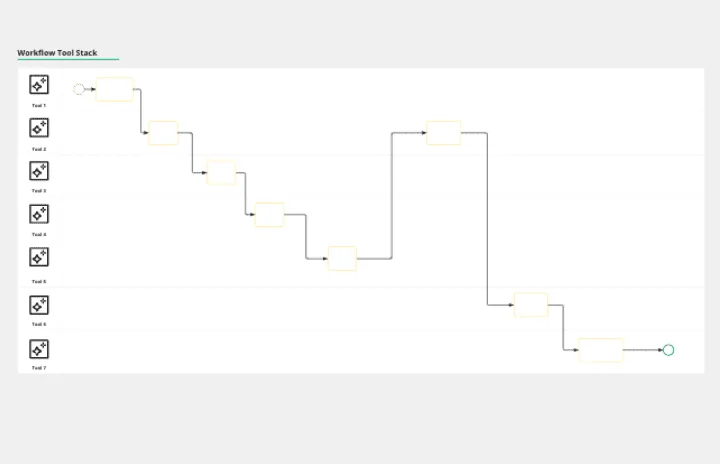
ICOR® Workflows
Works best for:
Flowcharts, Diagrams, Mapping
The ICOR® Workflows template offers a visual framework for documenting and optimizing business processes according to the ICOR® (Input, Control, Output, Resources) methodology. It provides elements for defining process inputs, controls, outputs, and resource requirements. This template enables organizations to streamline operations, enhance quality management, and achieve process excellence. By promoting systematic process documentation and analysis, the ICOR® Workflows template empowers organizations to optimize efficiency, minimize risks, and deliver value to stakeholders effectively.
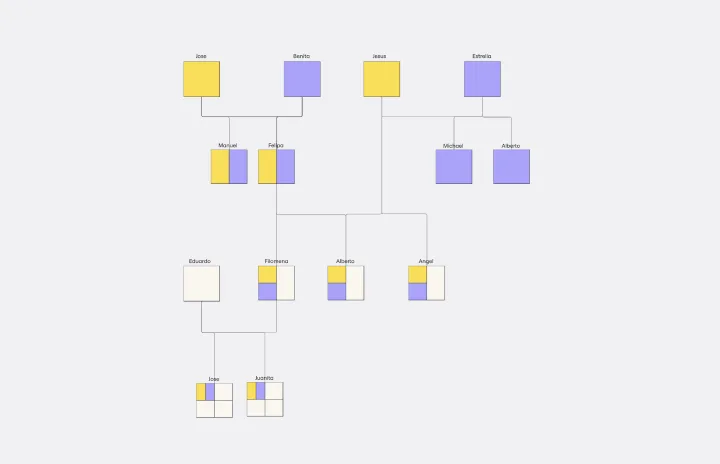
Genogram Template
Works best for:
Diagramming
The Genogram Template maps out family structures and relationships with exceptional depth and detail. Unlike traditional family trees, this template provides a comprehensive perspective by encapsulating familial connections, emotional ties, and significant life events. Create a genogram to unearth patterns and trends within a family, whether hereditary or environmental. Professionals across different domains can gain a holistic understanding of familial dynamics by showing deep insights into the nuances of relationships, facilitating better communication and problem-solving.
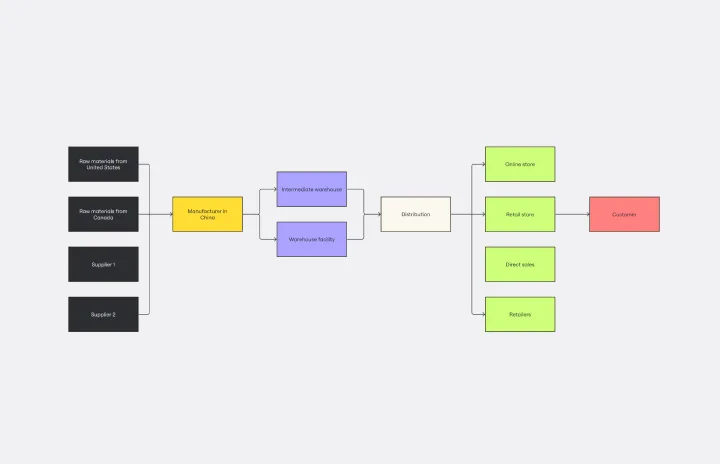
Supply Chain Diagram Template
Works best for:
Diagramming
The Supply Chain Diagram Template is great for businesses to streamline and enhance their supply chain processes. This template lets you visualize the entire supply chain, from sourcing raw materials to delivering finished products. Its intuitive layout simplifies complex networks, making identifying key areas and potential bottlenecks easier. One of the standout benefits of using this template is its clarity. It bridges the gap between complex processes and strategic decision-making by presenting a clear, visual supply chain representation. This clarity enables teams to pinpoint inefficiencies and implement more effective management strategies, which optimizes operations and facilitates better communication and understanding across different departments within an organization.