Supply Chain Diagram Template
Simplify complex processes, identify inefficiencies, and enhance operational clarity with the supply chain diagram template. Ideal for businesses looking to streamline their supply chain management.
Trusted by 65M+ users and leading companies


About the Supply Chain Diagram Template
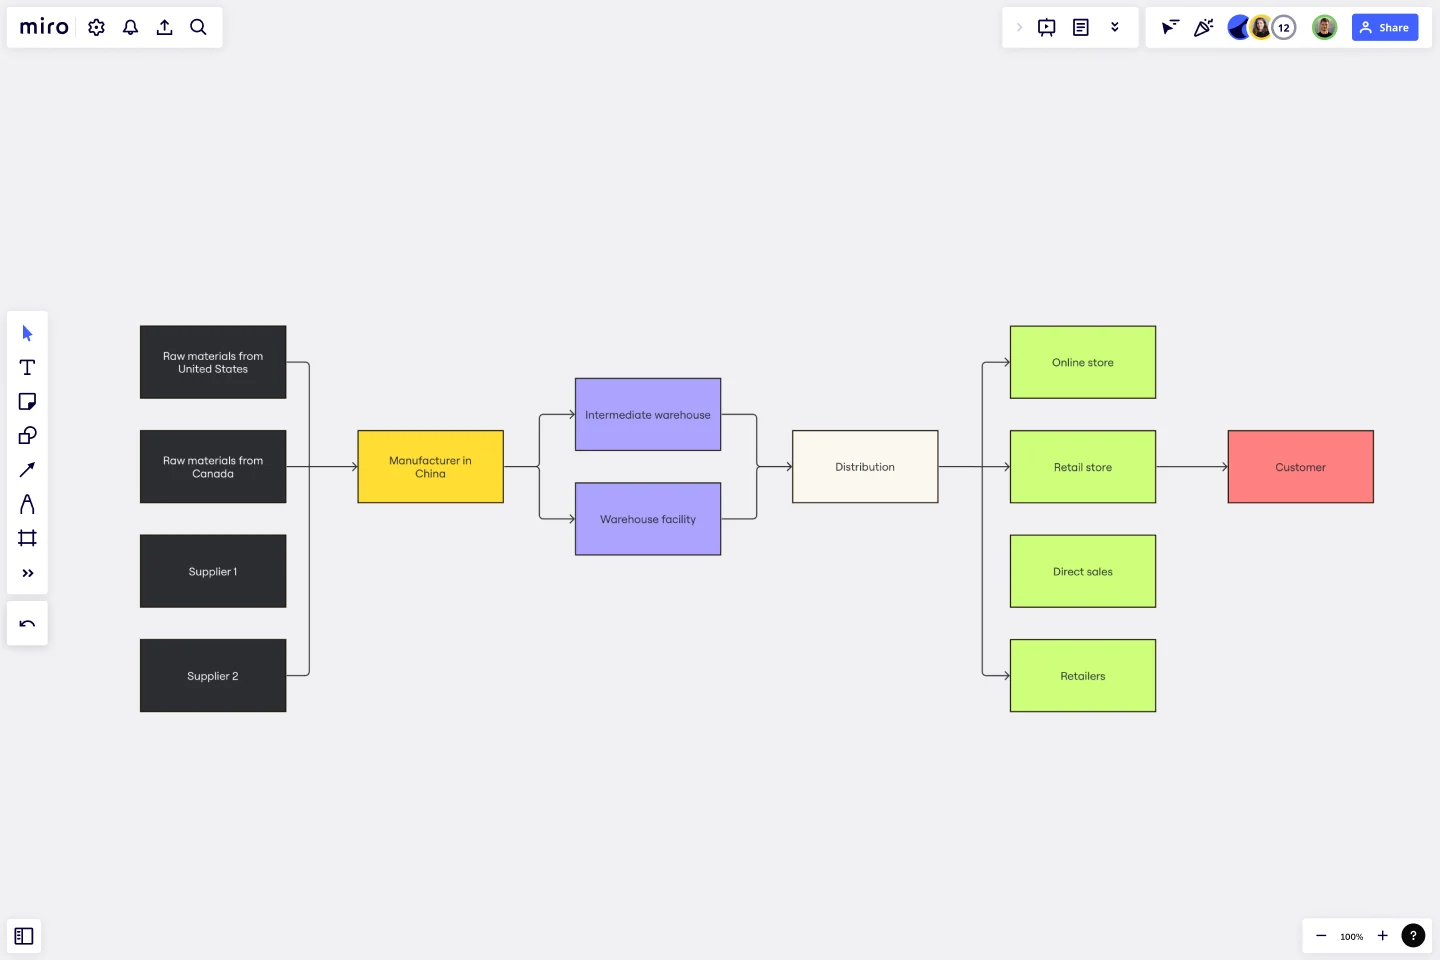
The supply chain diagram template is essential for businesses to visualize the movement of goods, information, and finances from supplier to customer. This visual representation plays a crucial role in optimizing operations, identifying bottlenecks, and improving the overall efficiency of the supply chain. The template itself is a pre-designed framework that outlines the critical components of the supply chain, providing a starting point for a detailed analysis.
This template for supply chain management includes various areas such as suppliers, manufacturers, distribution centers, and retail outlets, all of which are linked by transport. Each area can be further detailed with specific processes, timelines, and resources. The template can be used to break down each part of the supply chain to better understand and improve the complexities of product flow, communication channels, and financial transactions.
How to use the supply chain diagram template in Miro
Begin by selecting the Supply Chain Diagram Template from the template gallery.
Place the template on the board with just one click and immediately start customizing the diagram.
Edit text within pre-existing nodes to reflect the specific elements of your supply chain, from suppliers to end consumers.
Expand the template effortlessly by dragging new branches from the automated diagramming tools to add additional nodes.
Connect these nodes with connector lines to depict the flow and relationships within your supply chain.
Integrate artifacts such as images, documents, or links onto the board to provide deeper context and enrich the diagram with more information.
The ease of editing and customizing the template with just a few clicks allows for a streamlined approach to creating a detailed supply chain diagram, making it an efficient and intuitive experience.
Why should you use a supply chain diagram template?
There are several key benefits to using a Supply Chain Diagram Template:
The supply chain diagram template offers several benefits that can streamline the process of creating visual representations of complex supply chain structures.
Clarity: The template provides a clear visual representation of the supply chain process, making it easier to comprehend and communicate the process in a straightforward manner.
Efficiency: The template saves valuable time in designing and laying out the supply chain diagram, accelerating the process of creating it.
Customization: The template is highly customizable, which allows businesses to tailor the diagram to their specific needs and highlight particular areas of interest.
Optimization: The template helps identify bottlenecks and inefficiencies within the supply chain, making it more straightforward to pinpoint areas requiring targeted improvements.
Collaboration: The template facilitates real-time collaboration among team members who can view, edit, and comment on the diagram, leading to more cohesive planning and decision-making.
If you'd prefer to start from scratch, Miro's diagramming tools are easy to use and come with a wide range of diagramming shapes in Miro's extensive library, so you'll find just what you need.
Can the supply chain diagram template accommodate multiple layers of suppliers and distributors?
The template is designed to be scalable. It can be extended to include as many layers as needed, providing a comprehensive view of extended supply networks.
Is technical expertise required to use this template effectively?
Not at all. The template is user-friendly and designed for people at all skill levels. Anyone can use it with minimal guidance, making it accessible to all professionals.
How can multiple users collaborate on the same supply chain diagram?
The template supports real-time collaboration. Multiple users can access and edit the diagram simultaneously, with changes being reflected instantly for all to see.
Are there limitations to how much I can customize the supply chain diagram template?
The template is highly flexible, allowing for extensive customization. You can change the colors, shapes, and sizes of nodes and connectors and add detailed descriptions, links, or other pertinent information to each diagram element.
Get started with this template right now.
Bubble Map Template
Works best for:
Diagramming, Mapping, Brainstorming
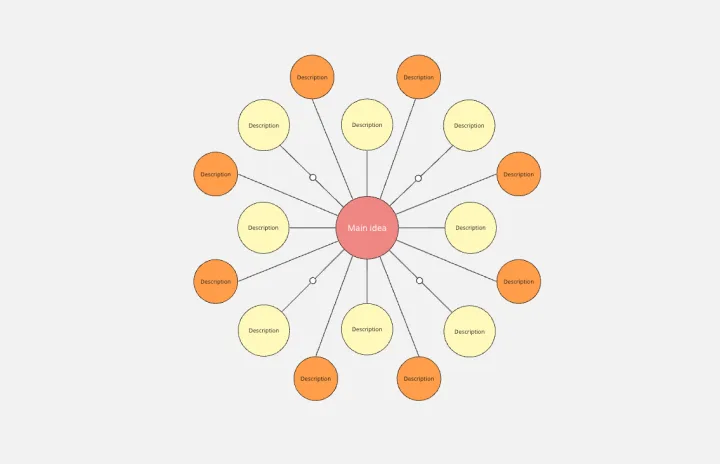
A Bubble Map Template is a visual organization tool that uses bubbles or circles to represent various ideas or data points. These bubbles are linked together, displaying their relationships and creating a network of interconnected thoughts. Use a Bubble Map Template to streamline complex information, enhancing comprehension and promoting efficient decision-making.
Inverted Org Chart Template
Works best for:
Org Charts, Organizational Design
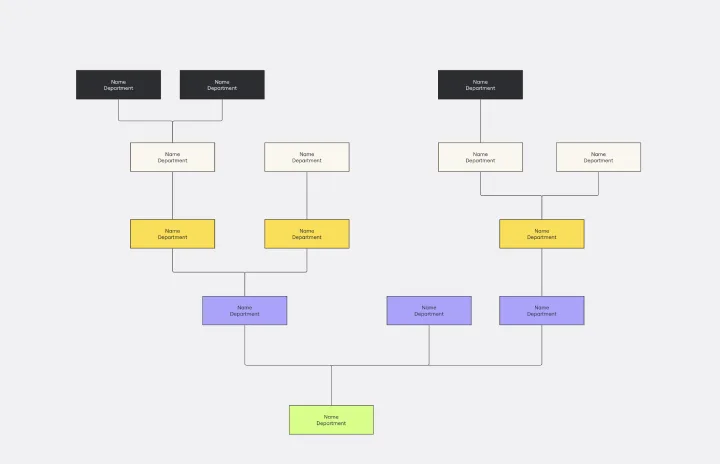
The Inverted Org Chart Template is a tool that reimagines the traditional hierarchical model by placing frontline employees at the top of the organizational structure. This innovative approach highlights the crucial role played by those who interact with customers directly, ensuring that their insights and contributions are not only recognized but also celebrated. One of the key advantages of this template is that it fosters a feedback-driven environment. Prioritizing frontline workers promotes a culture where valuable insights from the ground can quickly reach the top of the hierarchy, streamlining decision-making processes and ensuring that strategies are based on real-world experiences.
Workflow Diagram Template
Works best for:
Diagramming, Mapping, Process mapping
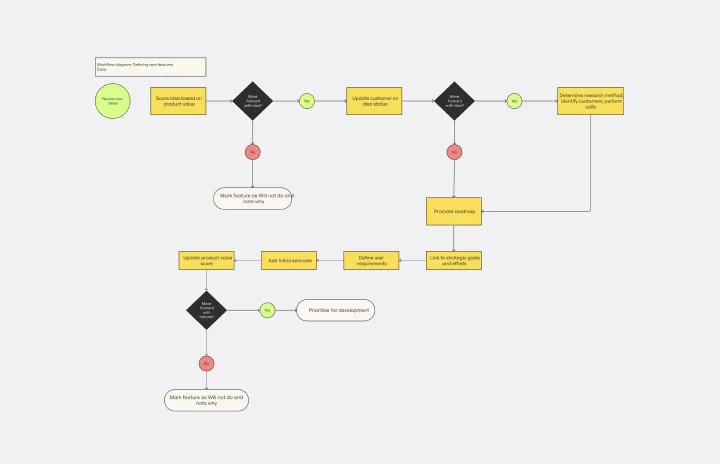
The Workflow Diagram Template maps out and represents processes or systems using standardized symbols and shapes. By delineating the various steps or stages in a process, it ensures that tasks flow seamlessly from initiation to completion. One of the standout benefits of using this template is its clarity. By translating processes into a visual format, all participants can gain a comprehensive understanding at a glance, eliminating confusion and ensuring everyone is on the same page. This clarity not only promotes efficient task execution but also fosters collaboration among team members.
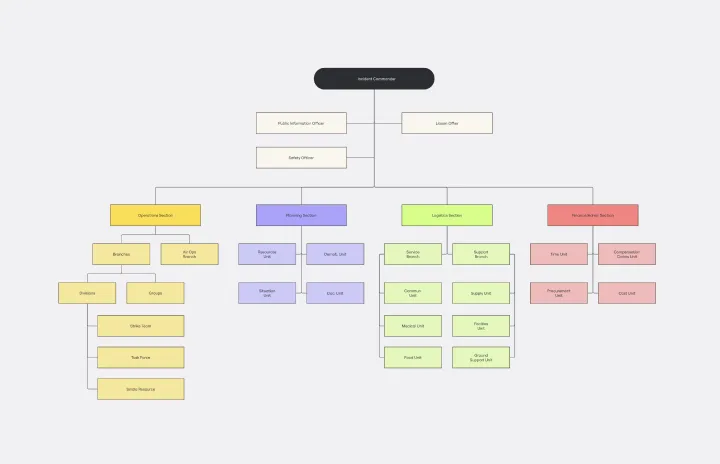
ICS Org Chart Template
Our carefully crafted ICS Org Chart Template is an invaluable tool designed to clearly represent the hierarchical structure of the Incident Command System (ICS). It simplifies the complex web of roles, responsibilities, and chains of command within the ICS, providing a structured blueprint for both experienced professionals and those new to the system. The template's most notable benefit is its ability to foster immediate understanding, bridging the gap between intricate organizational structures and the teams navigating them. Teams that use this template can ensure that everyone is aligned, understands their role, and collaborates efficiently, thereby reducing potential bottlenecks and misunderstandings.

Stage-Gate Process Flowchart Template
Works best for:
Diagramming, Project Management
The Stage-Gate Process Flowchart Template structures a project into distinct stages separated by decision-making gates, enhancing the quality of decisions and leading to more successful project outcomes.
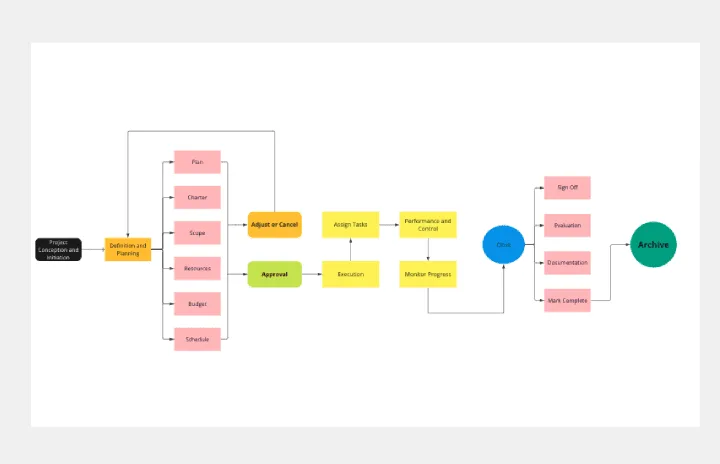
Project Management Flow Chart
Works best for:
Flowcharts, Diagrams, Mapping
The Project Management Flow Chart template offers a visual tool for planning and managing projects using flowchart diagrams. It provides elements for mapping out project phases, tasks, dependencies, and timelines. This template enables project managers and teams to visualize project workflows, identify critical paths, and track progress effectively. By promoting clarity and transparency, the Project Management Flow Chart empowers organizations to deliver projects on time, within budget, and according to specifications.