Bubble Map Template
Map ideas and data points quickly with a Bubble Map Template. Streamline complex information, promoting efficient decision-making in every project across your organization.
Trusted by 65M+ users and leading companies


About the Bubble Map Template
The Bubble Map Template stands out in data visualization and idea organization as an adaptable and easy-to-use tool. It allows you to arrange your thoughts, processes, or data in a visually appealing and understandable format, boosting efficiency and clarity. Whether brainstorming, strategizing, or presenting, use the Bubble Map Template as your go-to solution for turning complex ideas into clear visual narratives.
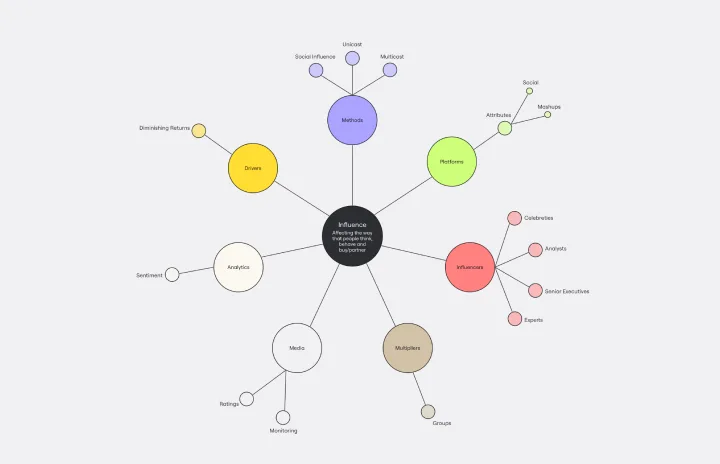
What's a Bubble Map Template?
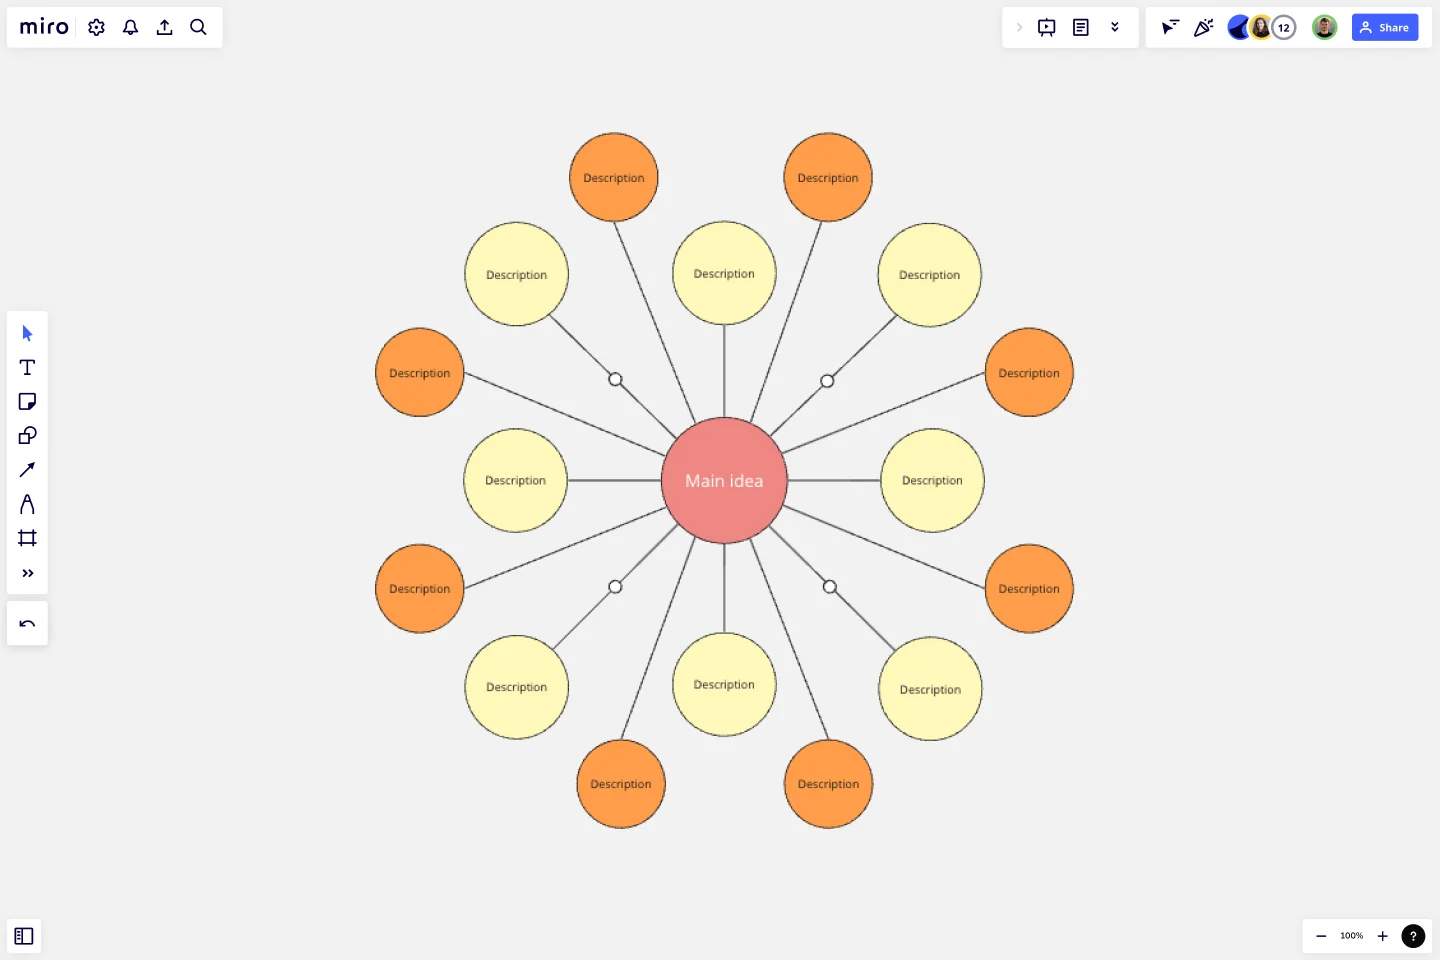
A Bubble Map Template is a diagramming tool used for visually organizing information. The diagram uses varying-sized circles or "bubbles" to represent concepts and lines to denote relationships or connections between them. It's a great tool for understanding complex systems, brainstorming ideas, or visualizing hierarchies and relationships.
Why should you use it?
Bubble maps help streamline thoughts, ideas, and information in an easily digestible format. They encourage critical thinking and facilitate understanding of relationships and patterns within complex data.
How to use a Bubble Map Template in Miro?
The Bubble Map Template in Miro offers a streamlined way to visually organize your ideas or data. Here's a quick guide to creating your Bubble Map:
Select the Bubble Map Template: Click on "Use template." The template will then be loaded onto your Miro board.
Edit the bubbles: Click on the template, and a text box will appear in the context menu bar. This will allow you to edit the central bubble or main idea. For resizing, click and drag the circle's edge. In the context menu, change the color of the bubbles and lines, adjust the font size and style within the bubbles, and even add icons or images to make your bubble map more visually engaging.
Auto-arrange and align: If you're dealing with many bubbles, Miro's auto-arrange and align feature can help you keep your map neat and readable.
Remember that you can invite others to collaborate on your bubble map in real-time, making it the ultimate bubble map maker and an excellent tool for brainstorming sessions, project planning, or team meetings. Enjoy visually mapping your thoughts and ideas with Miro's Bubble Map Template.
Can I collaborate with my team on a Bubble Map in real time?
Yes. Miro's collaborative features allow multiple users to work on the same Bubble Map simultaneously. Team members can add their input, make changes, and leave comments in real time, promoting dynamic and efficient collaboration.
Can I share my Bubble Map with others?
Absolutely. Miro lets you share your Bubble Map in several ways – via a link, email, or even embedded on a website. You can control whether recipients can view, comment or edit your map.
Can I use the Bubble Map Template offline?
Miro primarily operates online to enable real time collaboration. However, you can export your Bubble Map Template as a PNG, JPEG, or PDF file to view offline.
Get started with this template right now.
Personal Life Blueprint - Clarity Facilitator
Works best for:
Diagramming
The Personal Life Blueprint Clarity Facilitator template is a visual tool for individuals to clarify their personal goals, values, and priorities. It provides a structured framework for reflecting on different aspects of life and setting actionable objectives. This template enables individuals to gain clarity, focus, and direction in their personal and professional lives. By promoting self-awareness and goal-setting, the Personal Life Blueprint empowers individuals to lead more fulfilling and purpose-driven lives.
Fishbone Diagram Template
Works best for:
Operations, Diagrams, Workflows
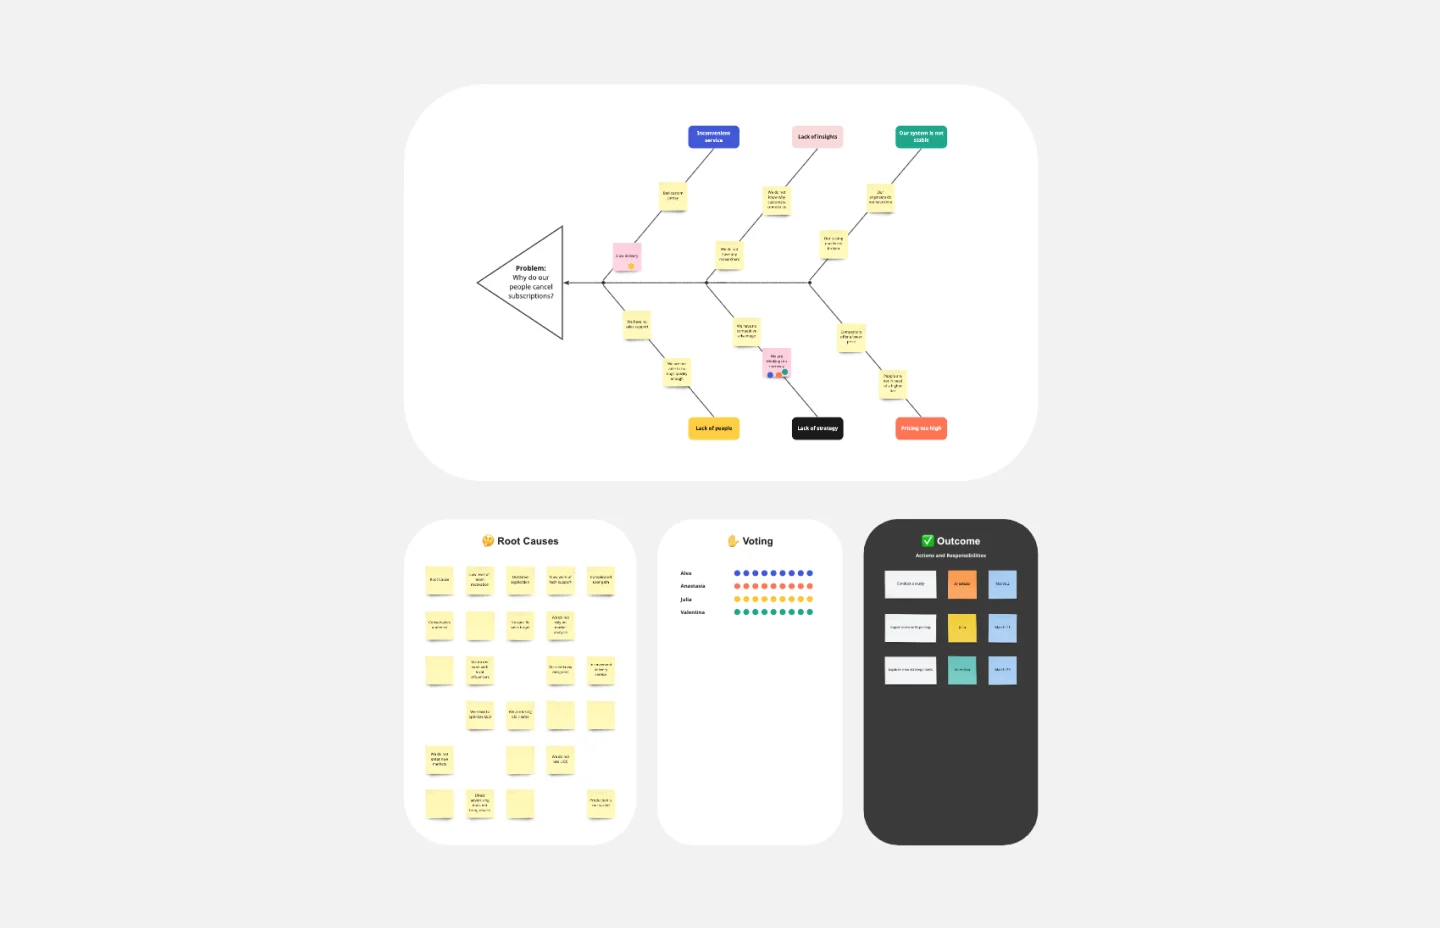
What is the best way to solve any problem your team faces? Go straight to the root. That means identifying the root causes of the problem, and fishbone diagrams are designed to help you do it best. Also known as the Ishikawa Diagram (named after Japanese quality control expert Kaoru Ishikawa), fishbone diagrams allow teams to visualize all possible causes of a problem, to explore and understand how they fit together holistically. Teams can also use fishbone diagrams as a starting point for thinking about what the root cause of a future problem might be.
Strategic Group Mapping Template
Works best for:
Mapping, Strategy
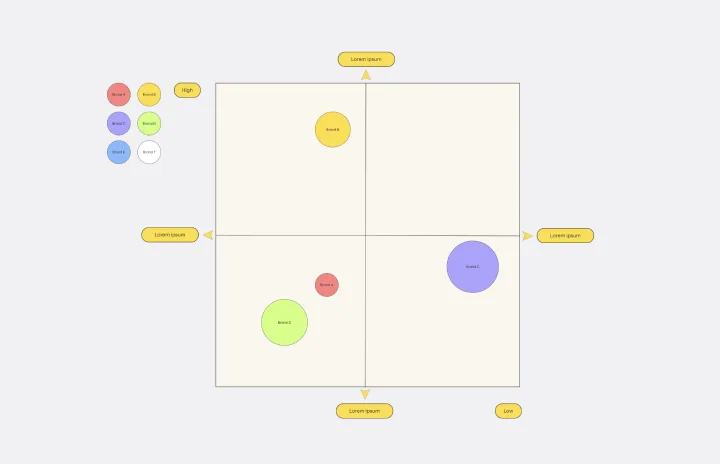
The Strategic Group Mapping Template is a cutting-edge visual tool designed to translate the competitive landscape of their industry. By allowing users to plot entities based on distinct criteria, this template provides an at-a-glance view of market dynamics. One standout benefit of using this tool is its ability to identify clusters of competitors and market gaps, paving the way for businesses to strategically position themselves for optimal success.
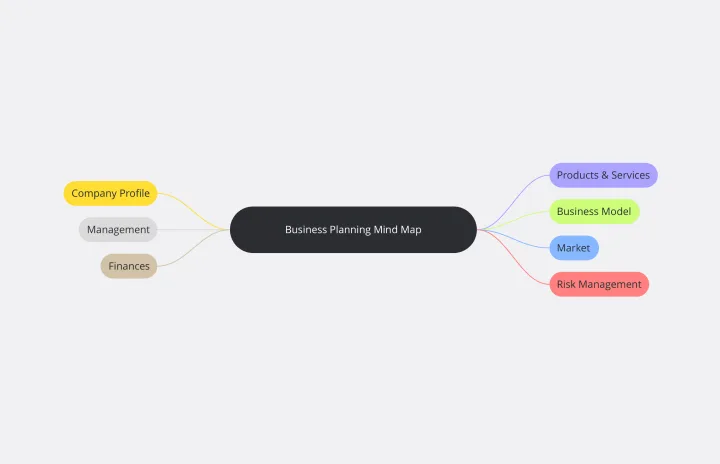
Business Plan Mind Map Template
Works best for:
Strategy, Planning
The Business Plan Mind Map Template simplifies complex business information by visually organizing each plan section as a branch on a mind map. This enhances communication, understanding, and attention to crucial aspects, making it an essential tool for developing effective business strategies.
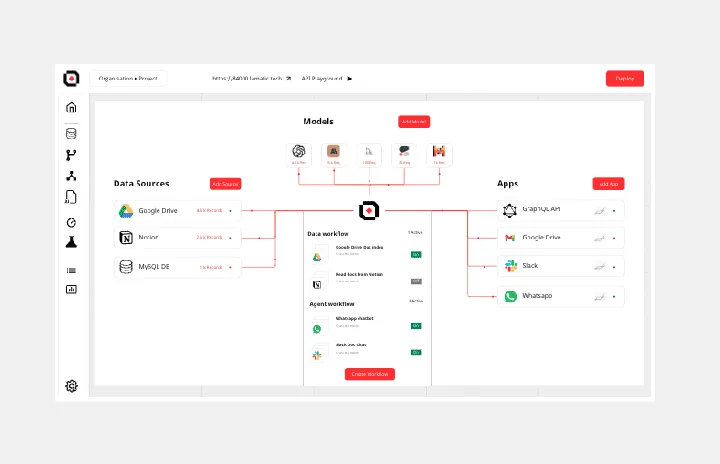
GenAI Application Workflow
Works best for:
Flowcharts, Mapping, Diagrams
The GenAI Application Workflow template is a visual tool for mapping out the workflow of applications developed using GenAI. It provides elements for defining process steps, decision points, and data flows within the application. This template enables developers and project teams to visualize the application workflow, identify potential bottlenecks, and optimize the user experience. By promoting clarity and efficiency in application development, the GenAI Application Workflow empowers teams to deliver innovative and user-friendly applications effectively.
Cluster Diagram Template
Works best for:
Diagramming
The Cluster Diagram Template is a valuable tool for organizing and connecting ideas, concepts, and information in a visually compelling and coherent manner. The template's design centers on grouping related ideas around a core concept, creating a transparent and hierarchical structure. This clustering not only aids in breaking down complex information into manageable segments but also significantly enhances the process of idea generation and brainstorming. A structured yet flexible visual framework encourages deeper engagement and more precise understanding, making it an essential asset for teams and people looking to bring order to their creative and analytical processes. I have checked the text for any potential spelling, grammar, and punctuation errors, and it's good to go.