ダイアグラム作成用テンプレート
ダイアグラム作成用のテンプレートコレクションを使用して、作図プロセスに必要なすべてのステップに沿って図表を作成し、プロジェクトの全体像の見える化を実現しましょう。行動を起こし、プロジェクトに求められる成果が得られるよう、チームの意欲を引き出しましょう。
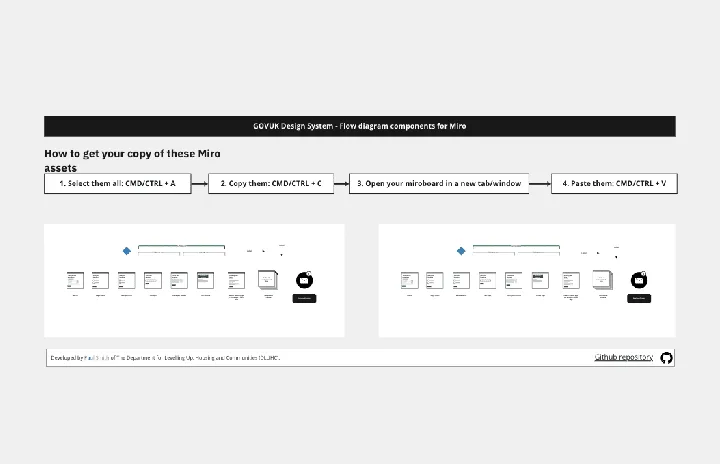
Flow Diagrams
活躍するシチュエーション:
Diagramming
The Flow Diagrams template offers a versatile tool for visualizing processes, workflows, and systems. It provides a range of shapes and connectors for creating flowcharts, process maps, and data flow diagrams. This template enables teams to represent complex systems and processes in a clear and structured manner, facilitating communication and decision-making. By promoting visual clarity and understanding, Flow Diagrams empower teams to analyze and optimize processes effectively, driving efficiency and productivity.
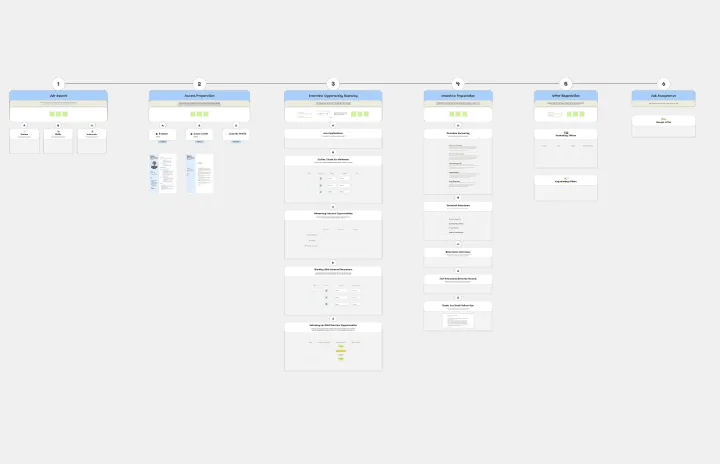
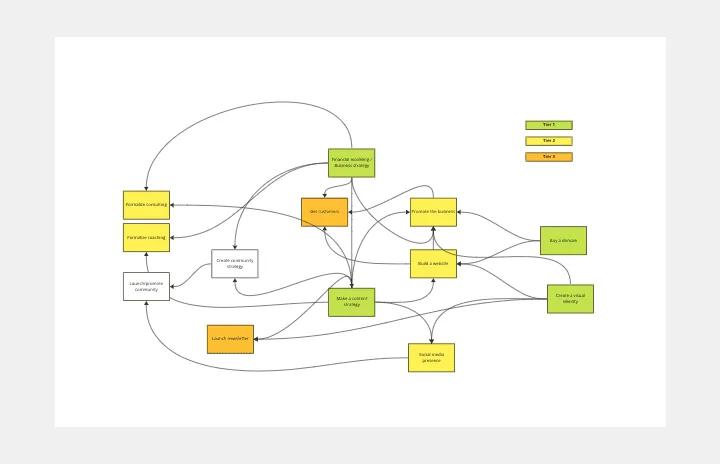
Job Search Process Diagram
活躍するシチュエーション:
Diagramming
The Job Search Process Diagram template offers a visual tool for mapping out the steps and stages involved in the job search process. It provides a structured framework for organizing tasks, tracking progress, and managing resources. This template enables job seekers to streamline their job search efforts, stay organized, and increase their chances of success. By promoting clarity and efficiency, the Job Search Process Diagram empowers individuals to navigate the job market effectively and achieve their career goals.
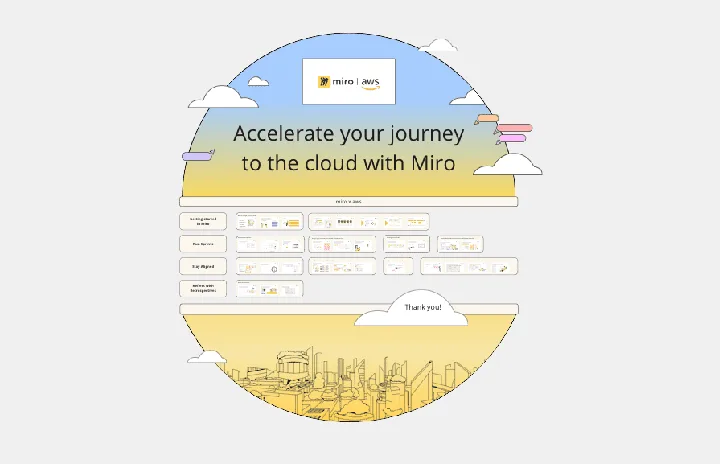
Miro x AWS: Accelerate your cloud journey
活躍するシチュエーション:
Diagramming
The Miro x AWS: Accelerate your cloud journey template offers a visual framework for planning and executing cloud migration and optimization projects using Amazon Web Services (AWS). It provides elements for mapping out cloud architectures, migration strategies, and cost optimization initiatives. This template enables teams to collaborate effectively, align on objectives, and accelerate their cloud journey with AWS services. By promoting collaboration and alignment, the Miro x AWS template empowers organizations to leverage AWS cloud technologies efficiently and achieve their business objectives effectively.
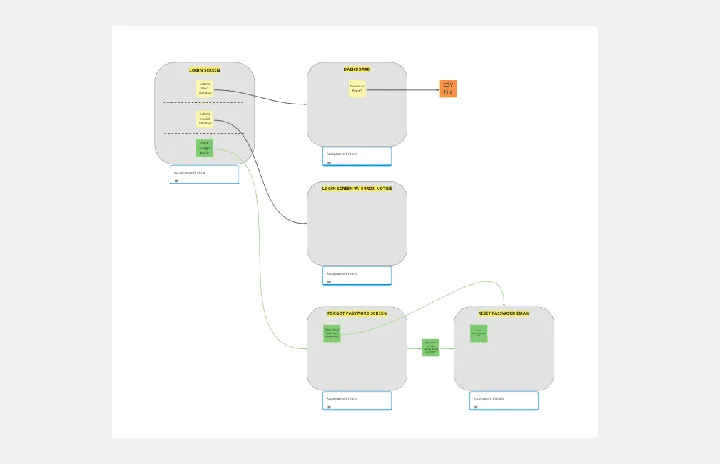
Breadboard (UI Flow Diagram)
活躍するシチュエーション:
Diagramming
The Breadboard (UI Flow Diagram) template offers a visual framework for designing and prototyping user interfaces (UIs) using the breadboard method. It provides elements for arranging UI components and defining user interactions. This template enables designers and developers to create interactive UI prototypes quickly and iteratively, facilitating user testing and feedback. By promoting rapid prototyping and experimentation, the Breadboard (UI Flow Diagram) empowers teams to design intuitive and user-friendly digital experiences effectively.
Affinity Diagram by UserPeek
活躍するシチュエーション:
Diagramming
The Affinity Diagram template is a visual tool for organizing and categorizing ideas, data, or issues into related groups. It provides a structured framework for conducting group brainstorming and affinity grouping activities. This template enables teams to synthesize information, identify patterns, and generate insights collaboratively. By promoting creativity and collaboration, the Affinity Diagram empowers teams to organize and prioritize information effectively, driving decision-making and problem-solving processes efficiently.
Interrelationship Diagram
活躍するシチュエーション:
Diagramming
The Interrelationship Diagram template is a visual tool for analyzing and illustrating complex relationships between variables or elements within a system. It provides a structured framework for mapping out connections, dependencies, and interactions. This template enables teams to visualize patterns, identify causal relationships, and uncover insights into system behavior. By promoting systems thinking and understanding of interdependencies, the Interrelationship Diagram empowers organizations to make informed decisions and drive effective solutions to complex problems.
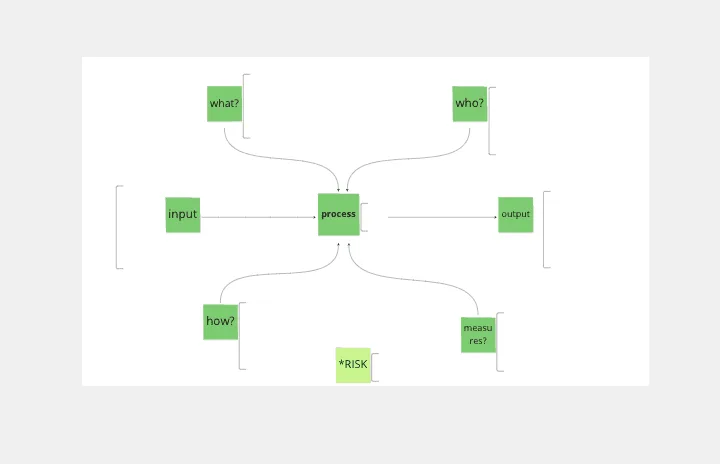
Turtle Diagram for BA
活躍するシチュエーション:
Diagramming
The Turtle Diagram for BA template offers a visual framework for defining and auditing business processes according to ISO 9001 standards. It provides elements for documenting process inputs, outputs, activities, and controls. This template enables organizations to ensure compliance, identify process improvements, and enhance quality management practices. By promoting systematic process documentation and auditability, the Turtle Diagram for BA empowers organizations to achieve and maintain ISO 9001 certification, demonstrating commitment to quality and continuous improvement.
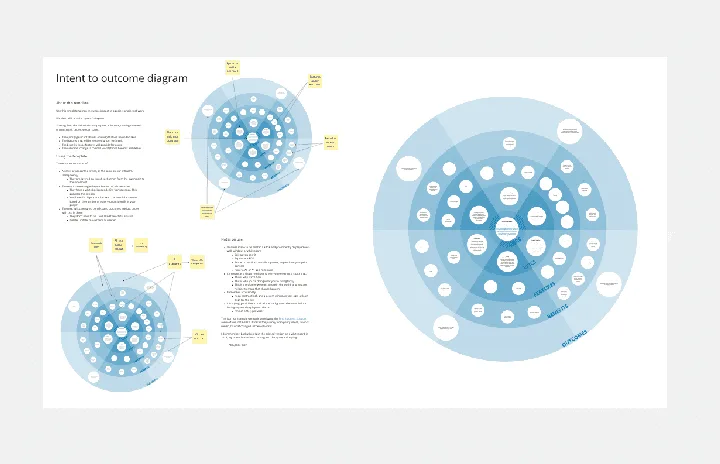
Intent to Outcome Diagram
活躍するシチュエーション:
Diagramming
The Intent to Outcome Diagram template is a visual tool for mapping out the relationship between desired outcomes and the actions required to achieve them. It provides a structured framework for defining intentions, outcomes, and key activities. This template enables teams to align on goals, track progress, and identify areas for improvement. By promoting clarity and alignment, the Intent to Outcome Diagram empowers organizations to set strategic direction and drive results effectively.
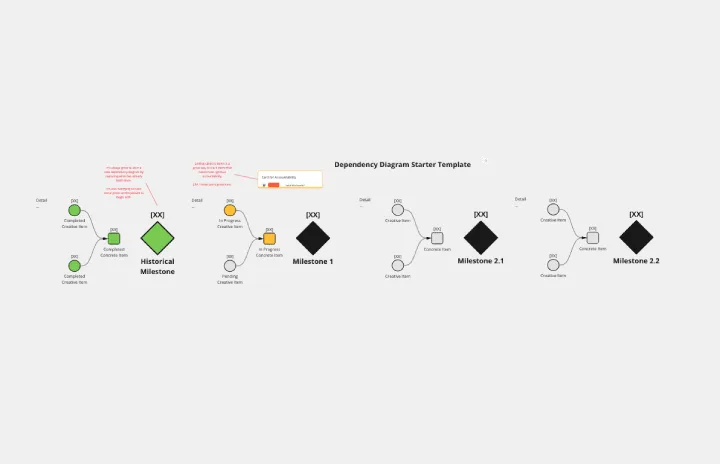
Dependency Diagrams Educational Board
活躍するシチュエーション:
Diagramming
The Dependency Diagrams Educational Board template provides a visual tool for teaching and learning about dependency relationships between components in systems. It offers a structured framework for illustrating dependencies, connections, and interactions within a system or process. This template enables educators to explain complex concepts effectively and engage learners in interactive activities. By promoting visual learning and understanding of dependencies, Dependency Diagrams empower students to grasp fundamental principles of systems thinking and analysis.
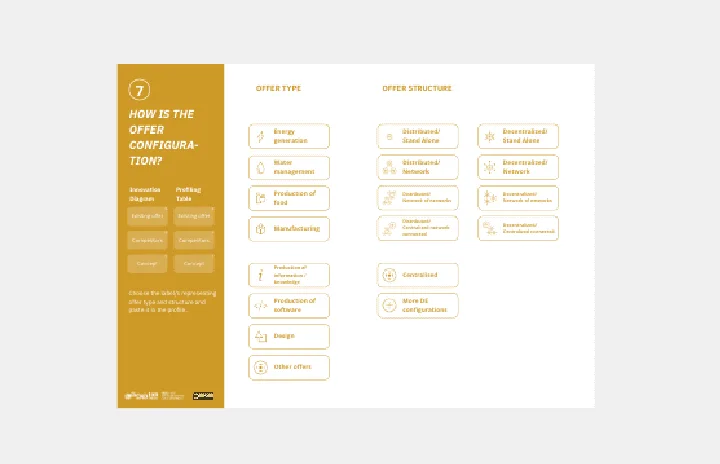
Innovation Diagram_S.PSS
活躍するシチュエーション:
Diagramming
The Innovation Diagram_S.PSS template offers a visual framework for mapping out the innovation process using the S.PSS (Service Product System Strategy) approach. It provides elements for defining service components, product features, and system interactions. This template enables teams to visualize and communicate their innovation strategy, facilitating alignment and collaboration across stakeholders. By promoting systematic innovation and holistic thinking, the Innovation Diagram_S.PSS empowers organizations to drive sustainable growth and competitive advantage through service and product innovation.
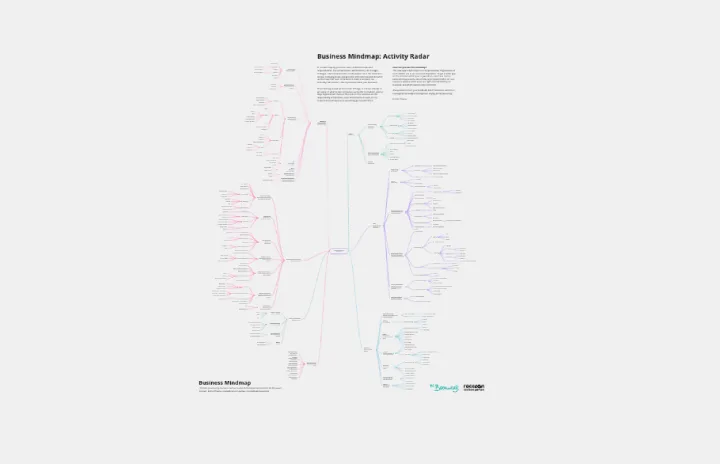
Business Mindmap
活躍するシチュエーション:
Diagramming
The Business Mindmap template is a visual tool for brainstorming, organizing, and presenting business ideas and concepts. It provides a structured framework for capturing and connecting thoughts, insights, and action items. This template enables teams to explore business strategies, analyze market trends, and develop innovative solutions. By promoting creativity and collaboration, the Business Mindmap empowers teams to generate and communicate actionable business plans effectively.

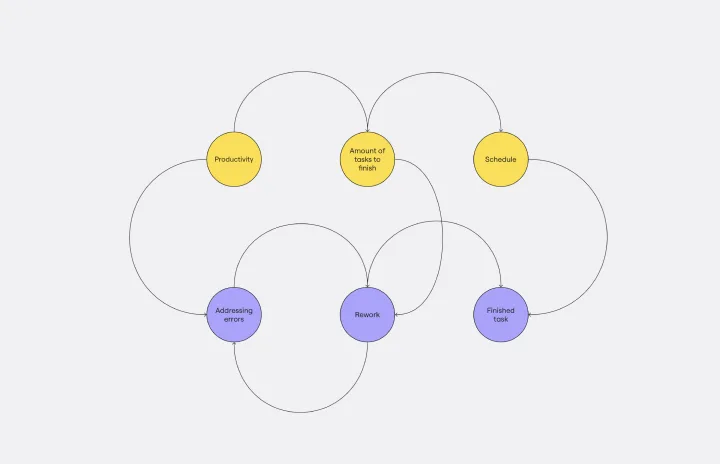
Causal Loop Diagrams (1.0)
活躍するシチュエーション:
Diagramming
The Causal Loop Diagrams (1.0) template offers a visual tool for modeling complex systems and understanding the feedback loops that drive behavior. It provides a structured framework for identifying causal relationships, reinforcing loops, and balancing feedback within a system. This template enables teams to analyze system dynamics, anticipate unintended consequences, and formulate effective strategies for intervention. By promoting systems thinking and understanding of interdependencies, Causal Loop Diagrams empower organizations to navigate complexity and drive sustainable change.
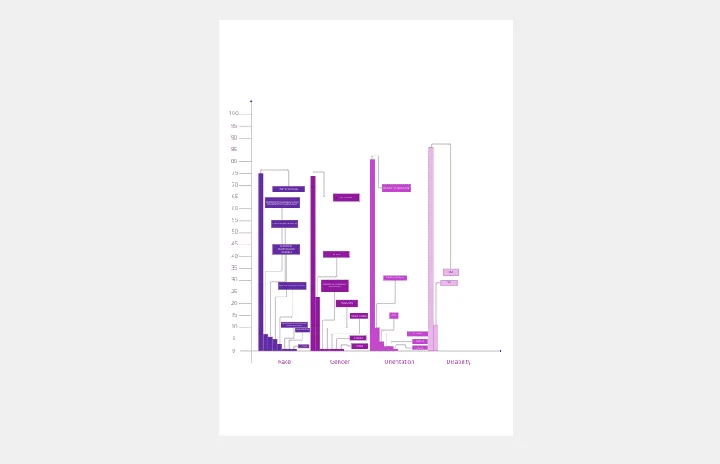
Bar Chart / Diagram Combined
活躍するシチュエーション:
Diagramming
The Bar Chart / Diagram Combined template offers a versatile tool for creating visualizations that combine bar charts with other diagrammatic elements. It provides elements for representing data trends, relationships, and comparisons effectively. This template enables teams to create customized visualizations that communicate complex information in a clear and compelling manner. By promoting visual clarity and insight, the Bar Chart / Diagram Combined template empowers teams to make data-driven decisions and communicate findings with impact.
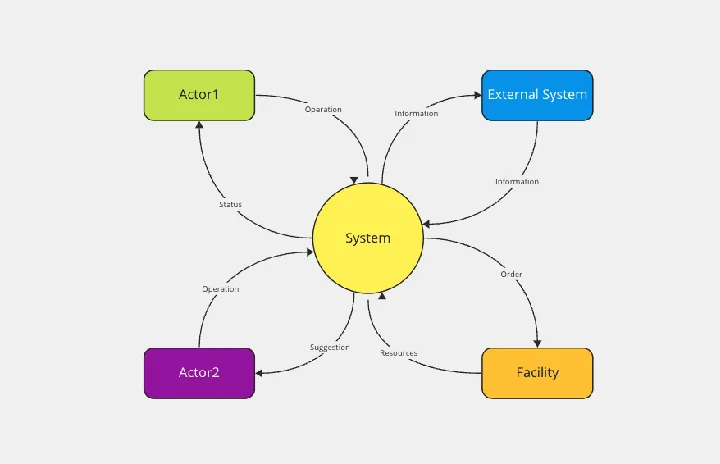
System Context Diagram
活躍するシチュエーション:
Diagramming
The System Context Diagram template is a visual tool for illustrating the relationships between a system and its external entities. It provides elements for depicting system boundaries, interfaces, and interactions with external stakeholders. This template enables teams to understand the broader context in which a system operates, facilitating requirements analysis and design decision-making. By promoting clarity and alignment, the System Context Diagram empowers teams to design systems that meet stakeholder needs and integrate seamlessly with their environment.
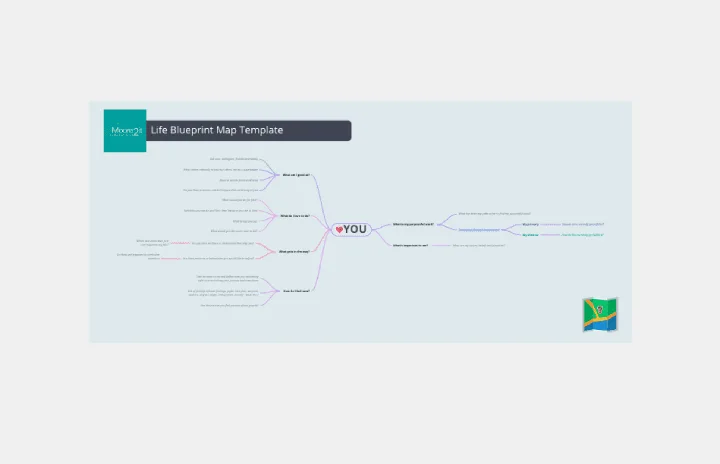
Personal Life Blueprint - Clarity Facilitator
活躍するシチュエーション:
Diagramming
The Personal Life Blueprint Clarity Facilitator template is a visual tool for individuals to clarify their personal goals, values, and priorities. It provides a structured framework for reflecting on different aspects of life and setting actionable objectives. This template enables individuals to gain clarity, focus, and direction in their personal and professional lives. By promoting self-awareness and goal-setting, the Personal Life Blueprint empowers individuals to lead more fulfilling and purpose-driven lives.
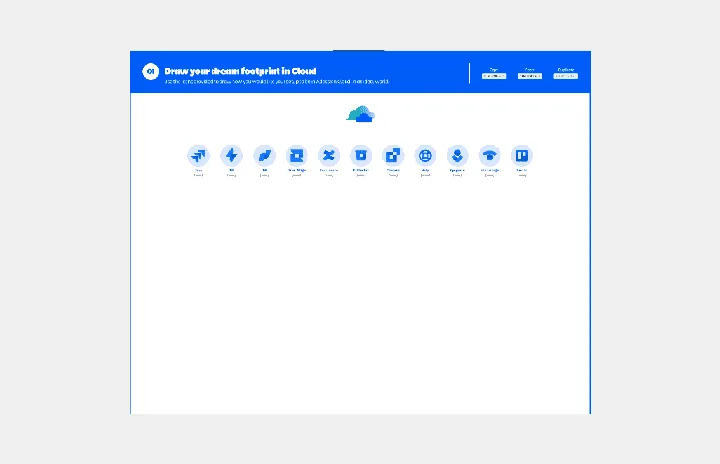
Cloud Blueprint
活躍するシチュエーション:
Diagramming
The Cloud Blueprint template offers a visual framework for designing and planning cloud-based architectures. It provides elements for mapping out cloud services, components, and dependencies. This template enables teams to visualize and communicate complex cloud infrastructure designs, facilitating collaboration and decision-making. By promoting clarity and alignment, the Cloud Blueprint empowers organizations to design scalable, resilient, and secure cloud solutions that meet business requirements and objectives.
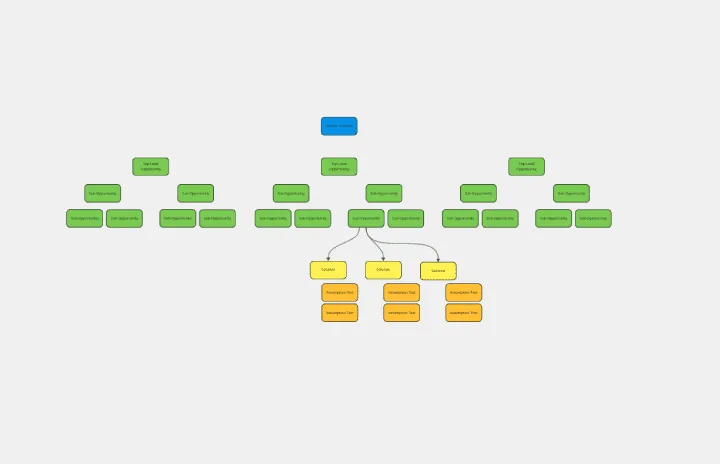
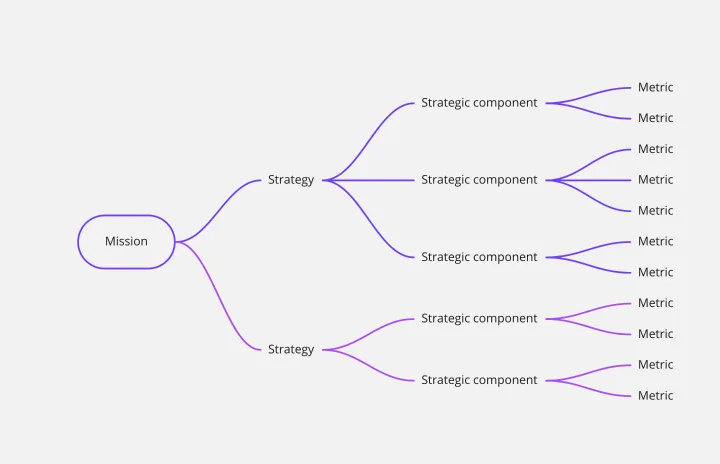
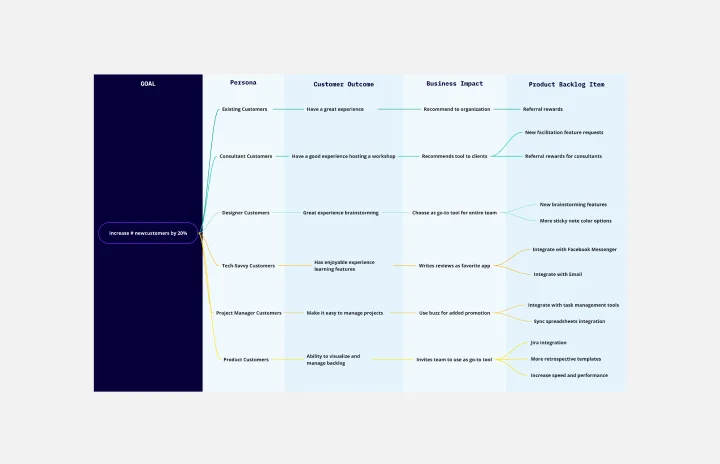
Opportunity Solution Tree
活躍するシチュエーション:
Diagramming
The Opportunity Solution Tree template is a visual tool for identifying and prioritizing opportunities and solutions. It provides a structured framework for mapping customer needs, pain points, and potential solutions. This template enables teams to explore divergent ideas, evaluate alternatives, and focus on high-impact solutions. By promoting customer-centricity and innovation, the Opportunity Solution Tree empowers teams to address market needs effectively and deliver value-driven solutions.

20/80 Process Diagram - EOS Compatible
活躍するシチュエーション:
Diagramming
The 20/80 Process Diagram - EOS® Compatible template is a visual tool for mapping out processes and workflows aligned with the Entrepreneurial Operating System (EOS®) methodology. It provides a structured framework for identifying core processes and key activities that drive business outcomes. This template enables organizations to streamline operations, clarify roles and responsibilities, and enhance accountability. By promoting alignment with EOS® principles, the 20/80 Process Diagram empowers teams to achieve organizational excellence and drive sustainable growth.
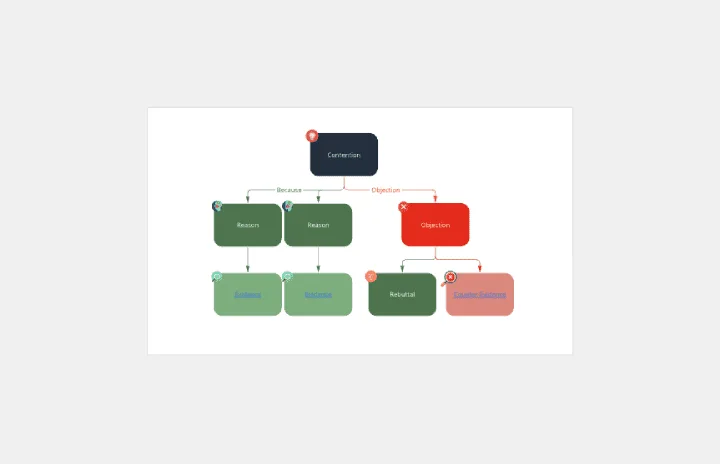
Argument Map
活躍するシチュエーション:
Diagramming
The Argument Map template is a visual tool for structuring and analyzing arguments and debates. It provides a structured framework for capturing premises, conclusions, and logical relationships. This template enables teams to explore complex issues, identify strengths and weaknesses in arguments, and make informed decisions. By promoting clarity and critical thinking, the Argument Map template empowers teams to navigate debates and discussions effectively, fostering consensus and understanding.
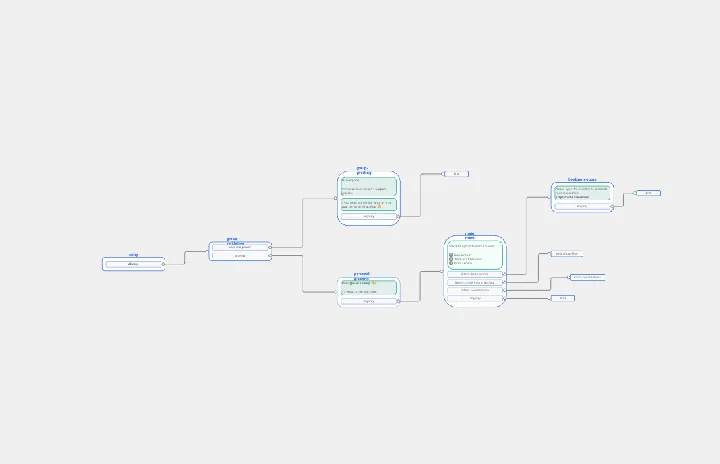
Chat-Bot
活躍するシチュエーション:
Diagramming
The Chat Bot template is a visual tool for designing and mapping out chatbot interactions and functionalities. It provides a structured framework for visualizing conversation flows, user inputs, and bot responses. This template enables teams to collaborate on designing chatbot experiences that are intuitive and user-friendly, driving engagement and satisfaction. By promoting clarity and alignment, the Chat-Bot template empowers organizations to create effective chatbot solutions that meet user needs and business objectives.
メンタルモデルテンプレート
活躍するシチュエーション:
Business Management, Mind Mapping, Diagrams
優れた組織は、スマートなソリューションと強力で戦略的な意思決定を両方とも実現し、その実施に役立つようメンタルモデルを設計しています。メンタルモデルを作成することで、リサーチの強固な基盤やユーザーエクスペリエンス全体を検証する方法をチームに提供でき、最適なデザインの意思決定にたどり着くことができます。また、Miro はこれを素早く、簡単に試してみることができる方法を提供しています。既製の柔軟なテンプレートに記入し、付箋、図形、矢印を追加するだけで、強力なマップを作成することができます。
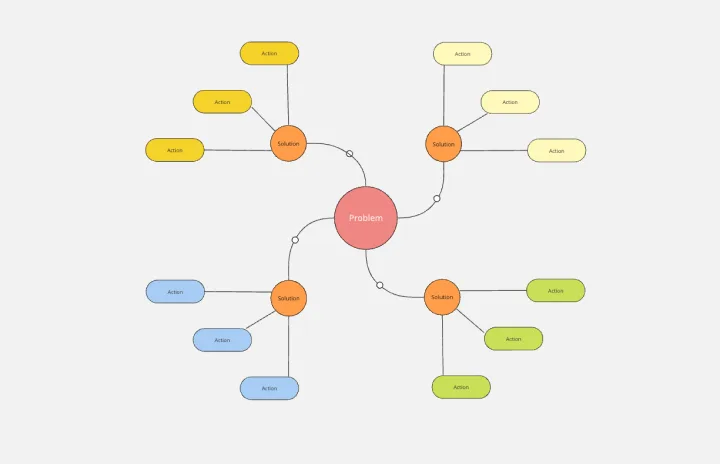
バブル図テンプレート
活躍するシチュエーション:
マッピングとダイアグラム作成, ダイアグラム作成, ブレインストーミング
バブル図(バブルマップ)テンプレートでアイデアやデータを素早くマッピング。複雑な情報を合理化し、組織全体のあらゆるプロジェクトで効率的な意思決定を促進しましょう。
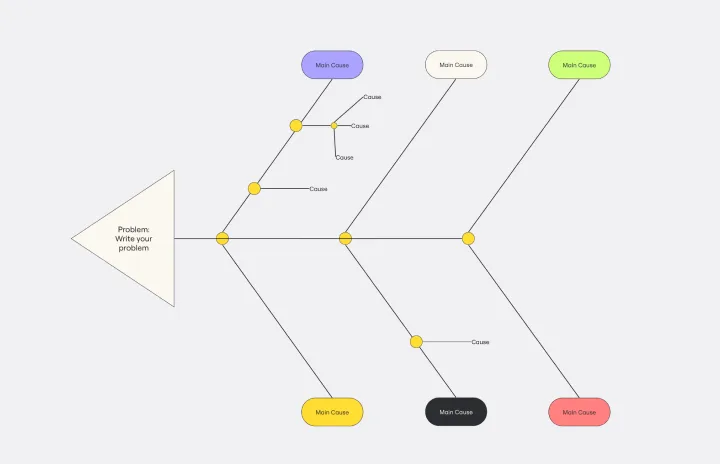
特性要因図テンプレート
活躍するシチュエーション:
ダイアグラム作成
Miro の特性要因図テンプレートを使ってシステムやプロセス内で発生している問題の根本的な原因を洗い出し、解決策を効率的に立てましょう。Miro では無料で特性要因図を作成することができます。
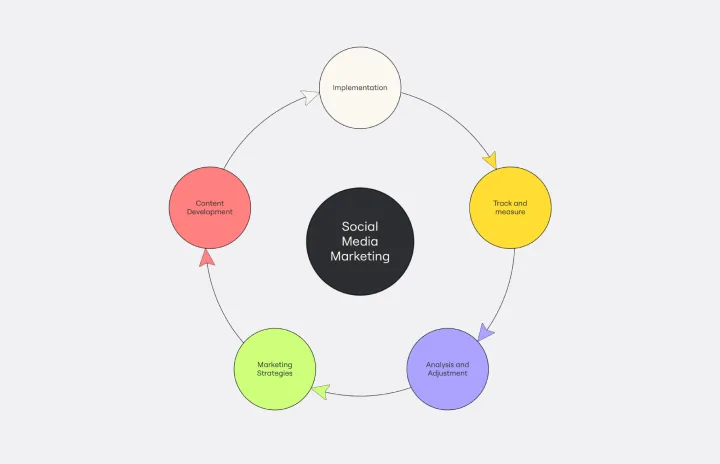
サイクル図テンプレート
活躍するシチュエーション:
ダイアグラム作成
無料のサイクル図テンプレートを使ってサイクルを可視化し、プレゼンテーションの資料などに使いましょう。オンラインで作成できるためプロジェクトメンバーと共有して、同じスペースで共同作業できます。
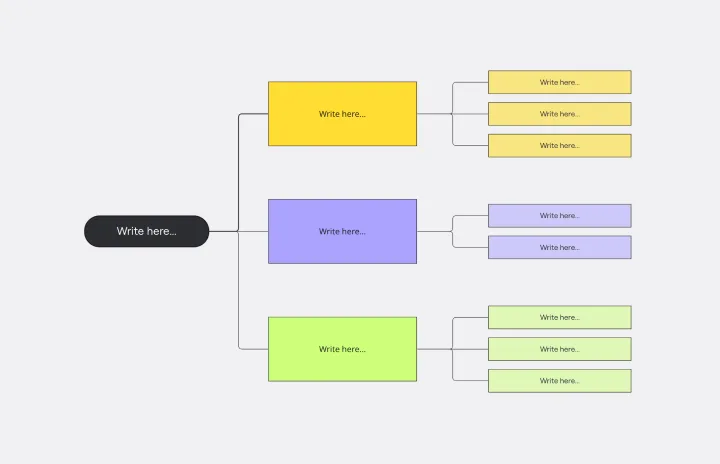
ウェビングマップテンプレート
活躍するシチュエーション:
ダイアグラム作成
ウェビングマップテンプレートを使えば、さまざまなプロジェクトで要素を簡単に相互接続し、アイデアを明確にすることができます。
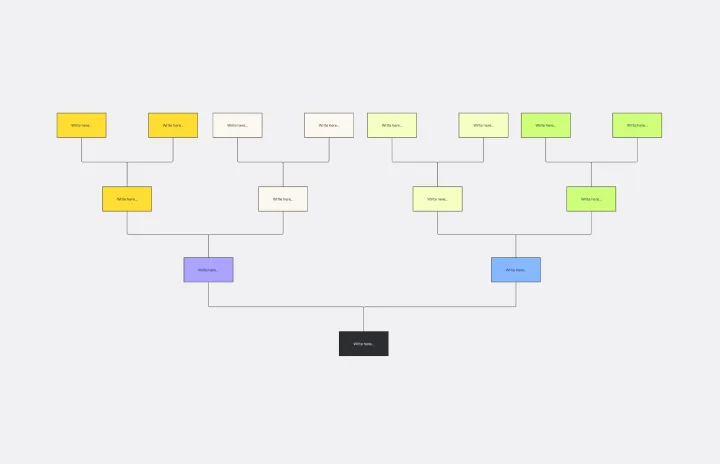
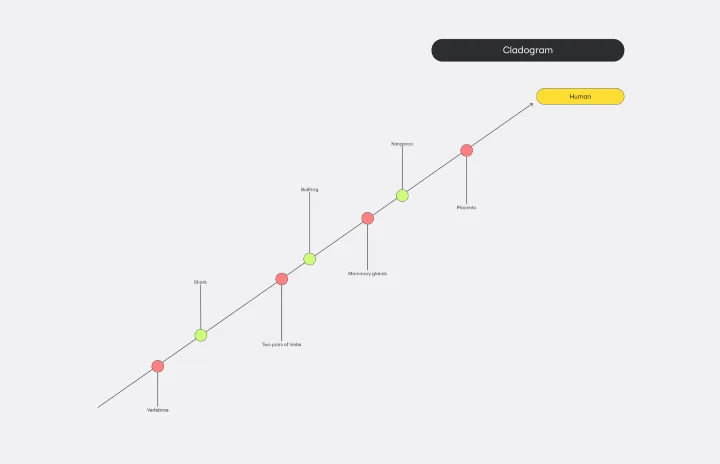
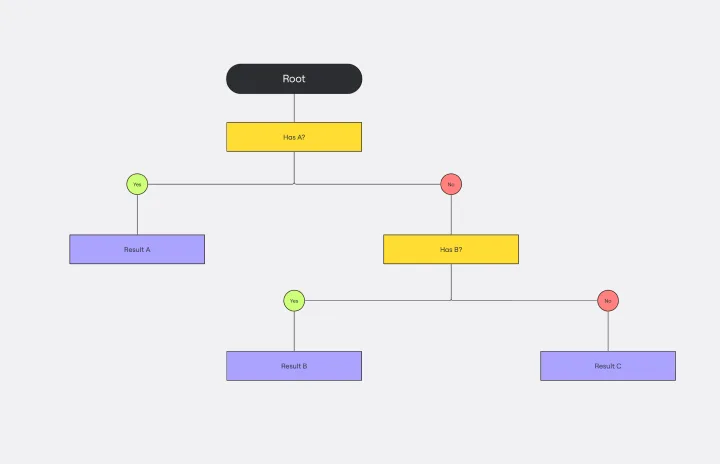
ロジックツリーテンプレート
活躍するシチュエーション:
ダイアグラム作成
Miro のロジックツリーテンプレートを使ってアイデアを整理し、ロジックに基づいた意思決定をしましょう。テンプレートは無料でご利用いただけます。オンラインでロジックツリーを作成できるので、完成したロジックツリーを他の人と共有したり、テンプレートをリアルタイムで一緒に編集することができます。ロジックツリーテンプレートを使って作図作業を効率化しましょう。
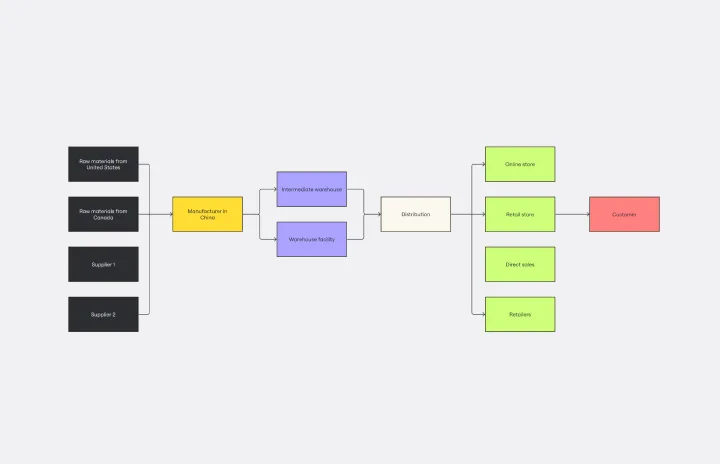
サプライチェーン図テンプレート
活躍するシチュエーション:
ダイアグラム作成
サプライチェーン図テンプレートを使ってプロセスを可視化し、改善点を発見しましょう。サプライチェーンマネジメントの効率化を目指す企業にとって役立つテンプレートです。

フォースフィールド分析テンプレート
活躍するシチュエーション:
ダイアグラム作成, 戦略と計画
フォースフィールド分析テンプレートを使って推進力と抑制力を特定し、アクションに優先順位をつけ、効果的な意思決定のためにチームのコンセンサスを得ましょう。
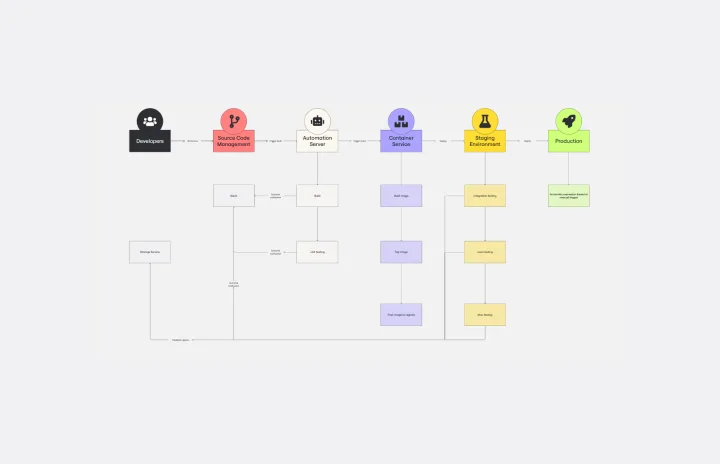
ソフトウェア開発ライフサイクルテンプレート
活躍するシチュエーション:
ダイアグラム作成
Miroのソフトウェア開発ライフサイクルテンプレートを活用して、開発チームが明確で合理的なコミュニケーションを促進し、構造化されたアプローチに沿って最短距離での開発推進をサポートします。
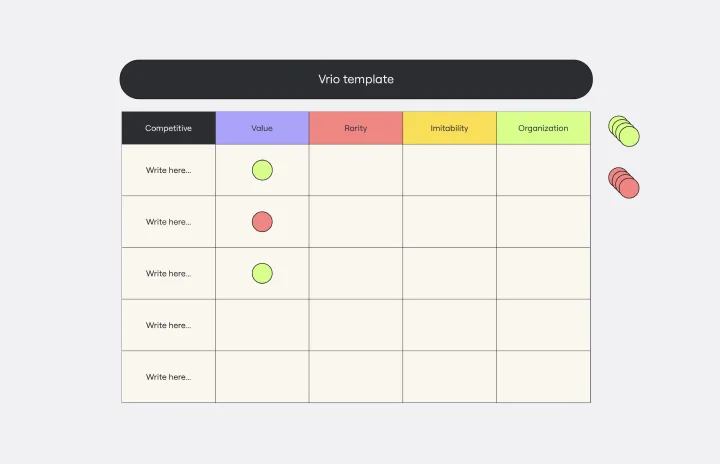
VRIO 分析テンプレート
活躍するシチュエーション:
ダイアグラム作成, 戦略と計画
VRIO 分析テンプレートは、企業が競争を優位に進めるためのリソースと能力を分析することに役立つフレームワークです。リソースを4つのカテゴリー(経済的価値・希少性・模倣可能性・組織)に分類することで、組織の強みと潜在的な弱みを視覚的に理解することができます。
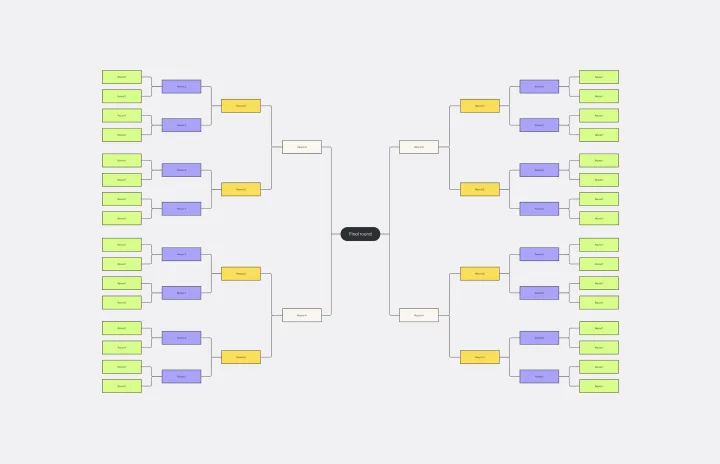
トーナメント表テンプレート
活躍するシチュエーション:
ダイアグラム作成
無料の素材や画像、テンプレートを使ってオリジナルのトーナメント表を作成しましょう。オンラインで作成できるため誰とでも Miro のトーナメント表テンプレートを共有することができます。

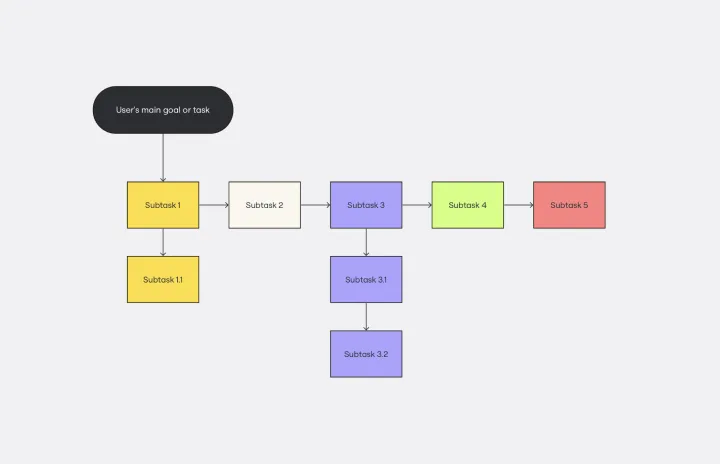
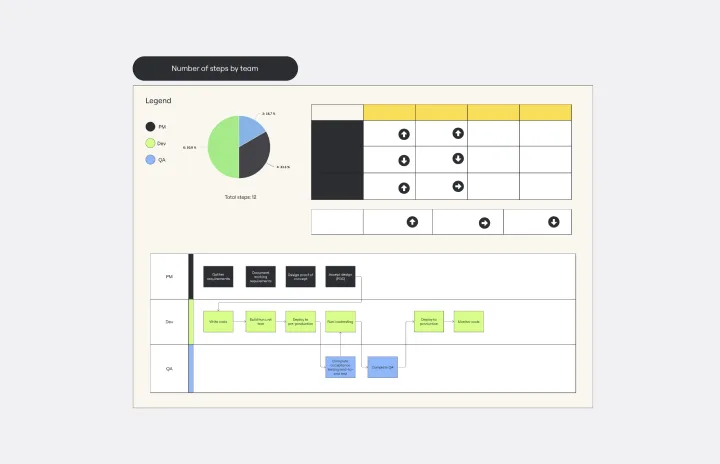
タスク分析テンプレート
活躍するシチュエーション:
プロジェクト管理, ダイアグラム作成
タスク分析テンプレートは、複雑なタスクをより小さく、より管理しやすいステップに分解するための便利なツールです。このテンプレートの最も大きな利点は、タスクの細部に至るまでマッピングし、タスクの見落としを防ぐことにあります。タスクの見落としを防ぐこで、プロジェクトにおいてのボトルネックを解消し、スムーズにプロジェクトを完了すること可能です。
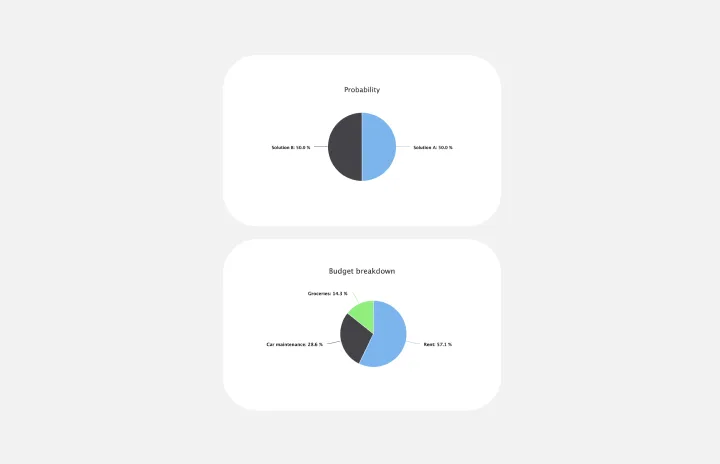
円グラフ(パイチャート)テンプレート
活躍するシチュエーション:
教育, オペレーション
別名パイチャートとも呼ばれる円グラフは、データ間の関係をグラフィカルに表現する優れた方法であり、情報を一目で比較することができるようになります。円グラフは、非常に人気のデータチャートの1つであり、プレゼンテーションなどでよく使用されます。
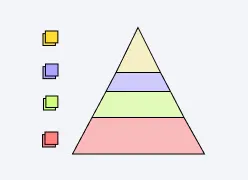
ピラミッド図テンプレート
活躍するシチュエーション:
Business Management, Strategic Planning, Prioritization
ピラミッド図は、レイヤー階層に分割できる概念を示すのに最適なツールです。ピラミッドの各レベルは、その前のレベルに基づいて構築され、特定の行動が具体的な結果につながる道筋を明確に示します。Miro ピラミッド図テンプレートは、あらゆるピラミッド型イラストのためのツールです。
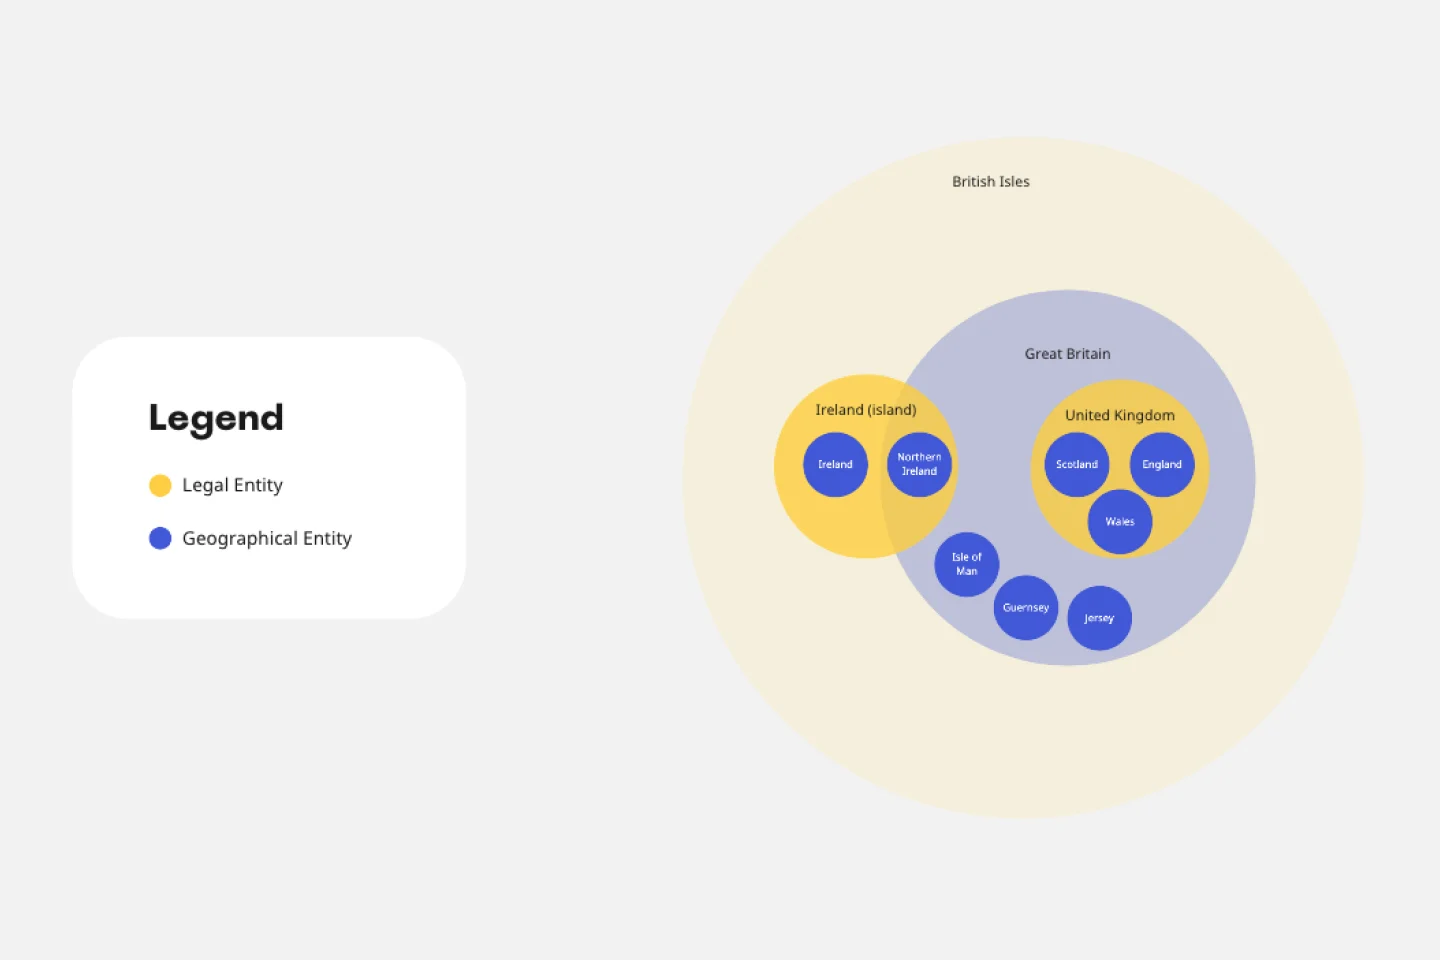
オイラー図テンプレート
活躍するシチュエーション:
Business Management, Operations, Diagrams
オイラー図は、円もしくは「セル」を使用して、対象間のさまざまな関係性を示すのに大いに役立ちます。オイラー図は、ITシステムで多く活用され、対象物の相互関係性とその作用性を明確にします。それ以外にも、オイラー図を利用すれば、関係性を見出す必要のあるいずれの事柄も説明可能になります。
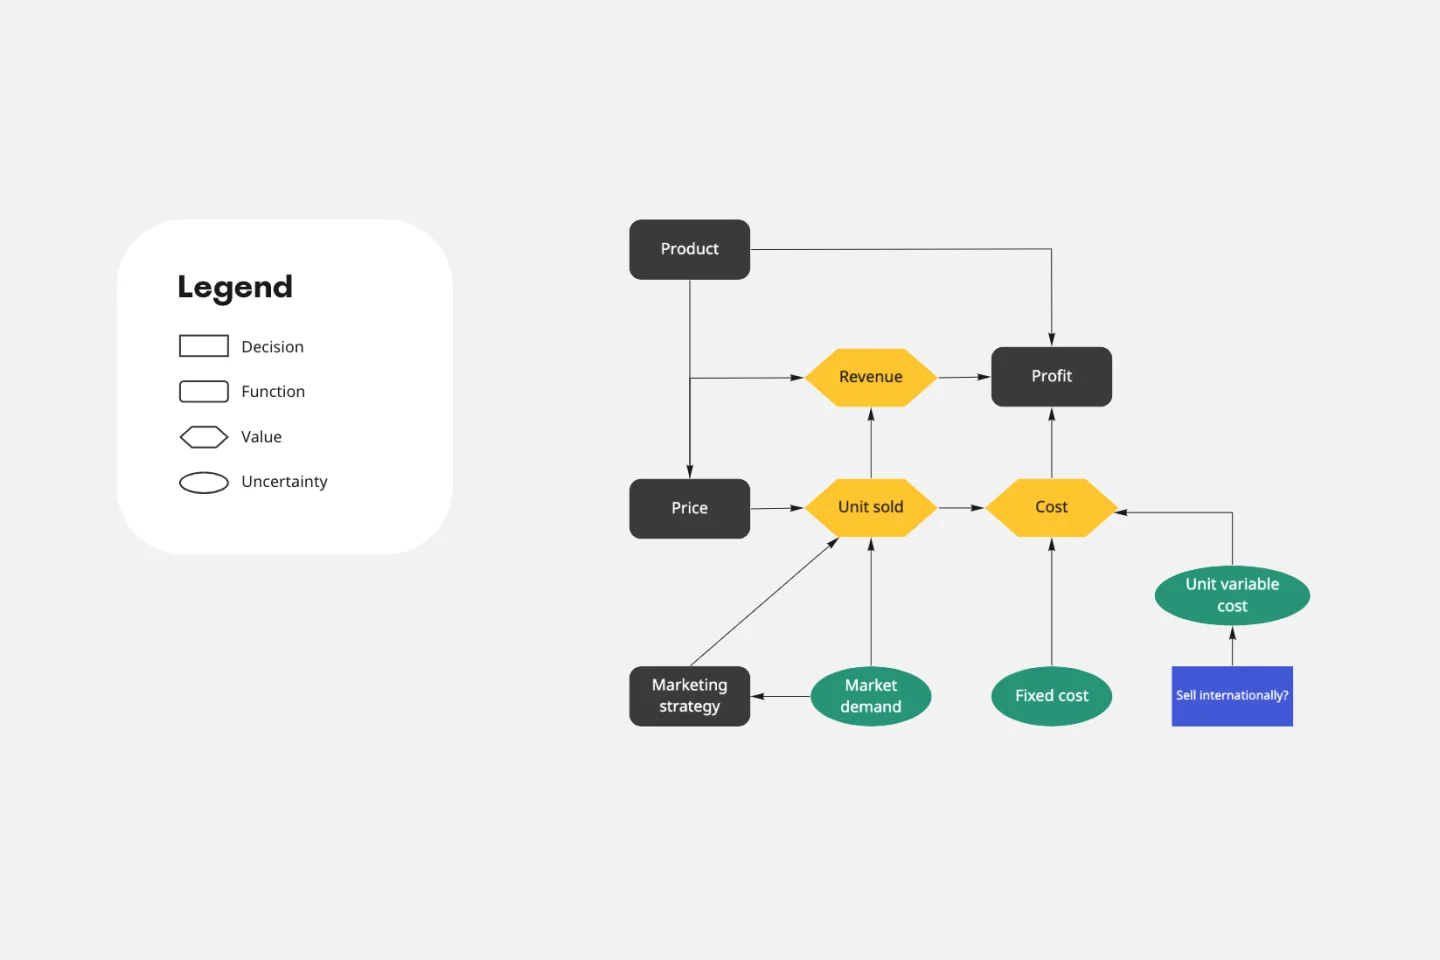
インフルエンス・ダイアグラムテンプレート
活躍するシチュエーション:
Business Management, Decision Making, Diagrams
このインフルセンス・ダイアグラムのテンプレートで、あらゆるビジネス上の意思決定の全体像を把握しましょう。決定が必要な要素を定義し、その決定に影響を与えうるすべての要素をブレインストーミングします。これらの要素に関連性を持たせることで、各要素に適切な重み付けを持たせた意思決定を下すことができます。
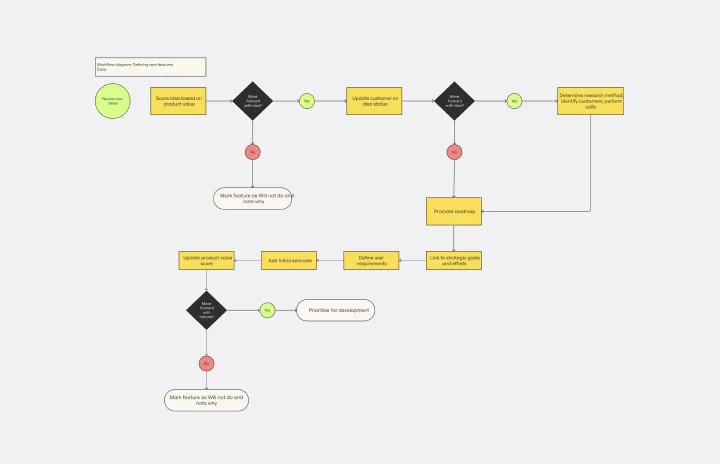
作業フロー図テンプレート
活躍するシチュエーション:
マッピングとダイアグラム作成, プロセスとワークフロー, フローチャート
作業フロー図テンプレートを使って、わかりやすい図で作業フローを可視化しましょう。プロセスを可視化することで誰でもフローを理解することでき、プロジェクトの生産性を向上することができます。
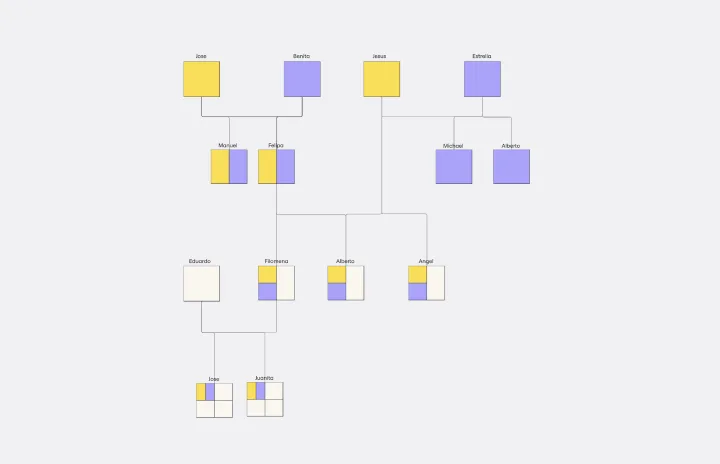
ジェノグラムテンプレート
活躍するシチュエーション:
ダイアグラム作成
無料のジェノグラムテンプレートを使って家族の詳細をマッピングしましょう。興味深いパターンや謎を解き明かすことができるかもしれません。
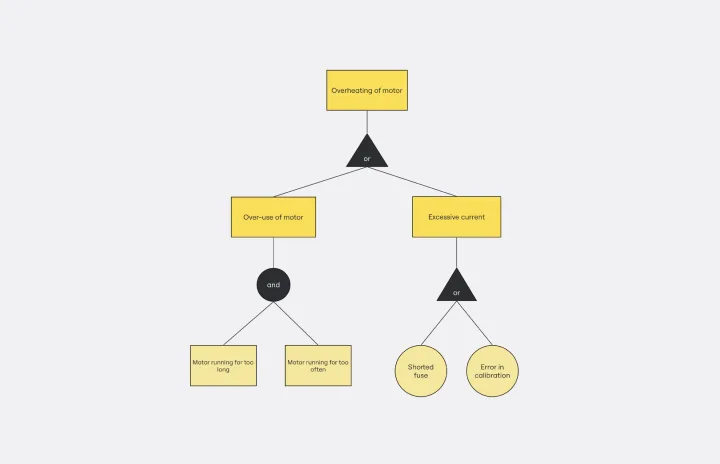
FTA テンプレート
活躍するシチュエーション:
マッピングとダイアグラム作成
Miro のFTA(故障の木解析)テンプレートを使って複雑な情報を明確化しましょう。問題解決へのアプローチを合理化し、システムの不具合をこのテンプレートで迅速に特定することができます。
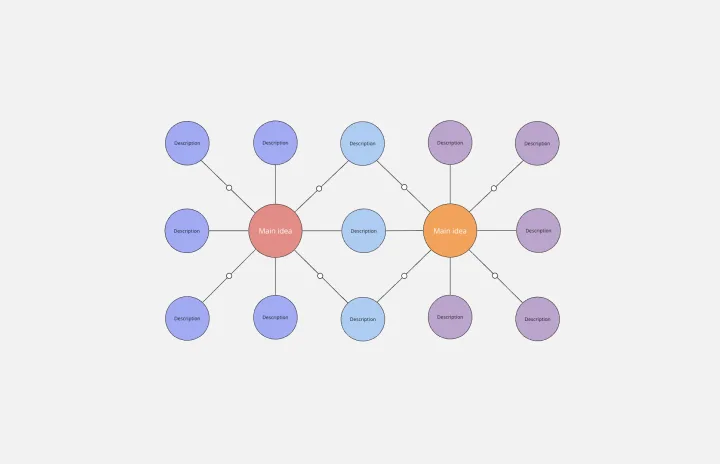
ダブルバブルマップテンプレート
活躍するシチュエーション:
マッピングとダイアグラム作成, ブレインストーミング, 意思決定
Miro のダブルバブルマップテンプレートでチームのコミュニケーションを促進しましょう。ブレインストーミングや問題解決、意思決定プロセスをこの無料のテンプレート1つで効率化することができます。
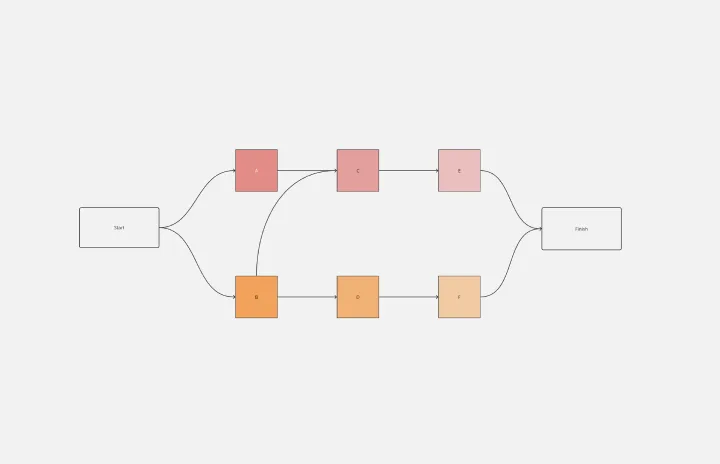
プレシデンスダイアグラムテンプレート
活躍するシチュエーション:
プロジェクト管理, マッピングとダイアグラム作成
プレシデンスダイアグラムテンプレートを使ってリソースの最適化を実現しましょう。どのタスクが実行可能で、どのタスクが他のタスクの完了を待つ必要があるかを可視化することで、リソースををより効果的に管理でき、プロジェクトを効率的に進めることができます。
戦略的計画テンプレート
活躍するシチュエーション:
プロジェクト計画, リーダーシップ, 戦略プランニング
目標を策定し、その達成に必要なステップを把握する必要に迫られたら、戦略的計画テンプレートを活用しましょう。戦略的計画テンプレートは、作業プロセスを通じて、現状を評価し、将来の目標を策定して、それらを実現するための計画の策定をサポートします。一般に戦略では何かを行うために目標や理由を考慮しますが、計画では目標の達成に必要な具体的なステップを考慮します。しかし、戦略的計画では、この 2 つを同時に考慮します。
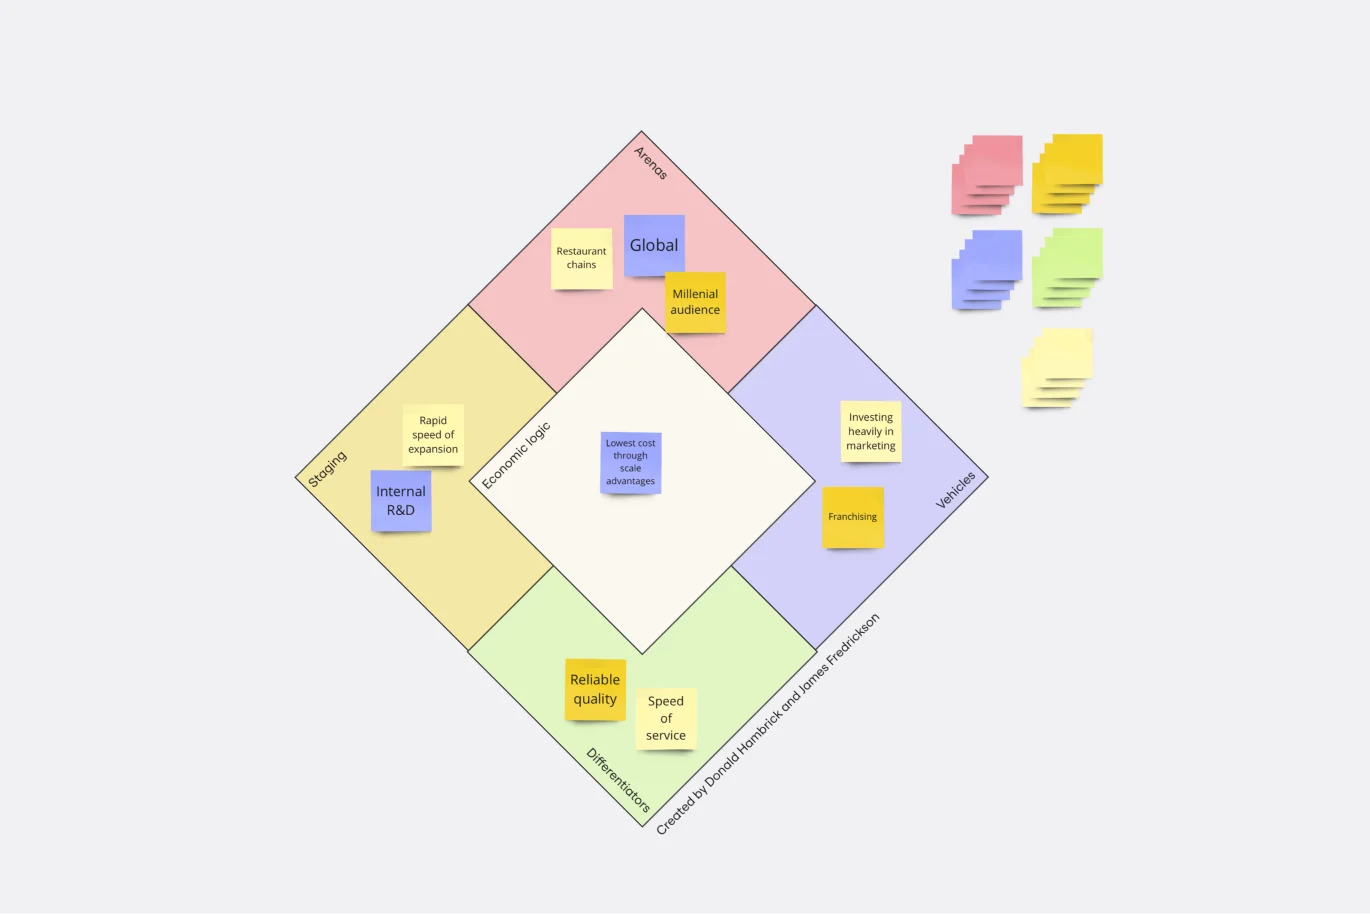
戦略ダイヤモンドテンプレート
活躍するシチュエーション:
Leadership, Operations, Strategic Planning
重要な目標を達成するために、ほとんどの企業が一通り戦略を組み立てます。しかし、どのような要素を考慮して戦略を立てるべきなのでしょうか?戦略ダイヤモンドは、一貫性があるビジネス戦略を形成する要素の集まりです。これらの要素には、ターゲット、差別化要因、達成手段、実現ステップ、経済論理が含まれます。戦略計画の多くは、これらの要素のうち 1 つか 2 つにしか焦点を当てないため、ギャップが生じ、後のビジネスの支障となる恐れがあります。戦略ダイヤモンドを使えば、戦略計画に集中し、1 つや 2 つだけではない、すべてのビジネス要件を満たすのに役立ちます。
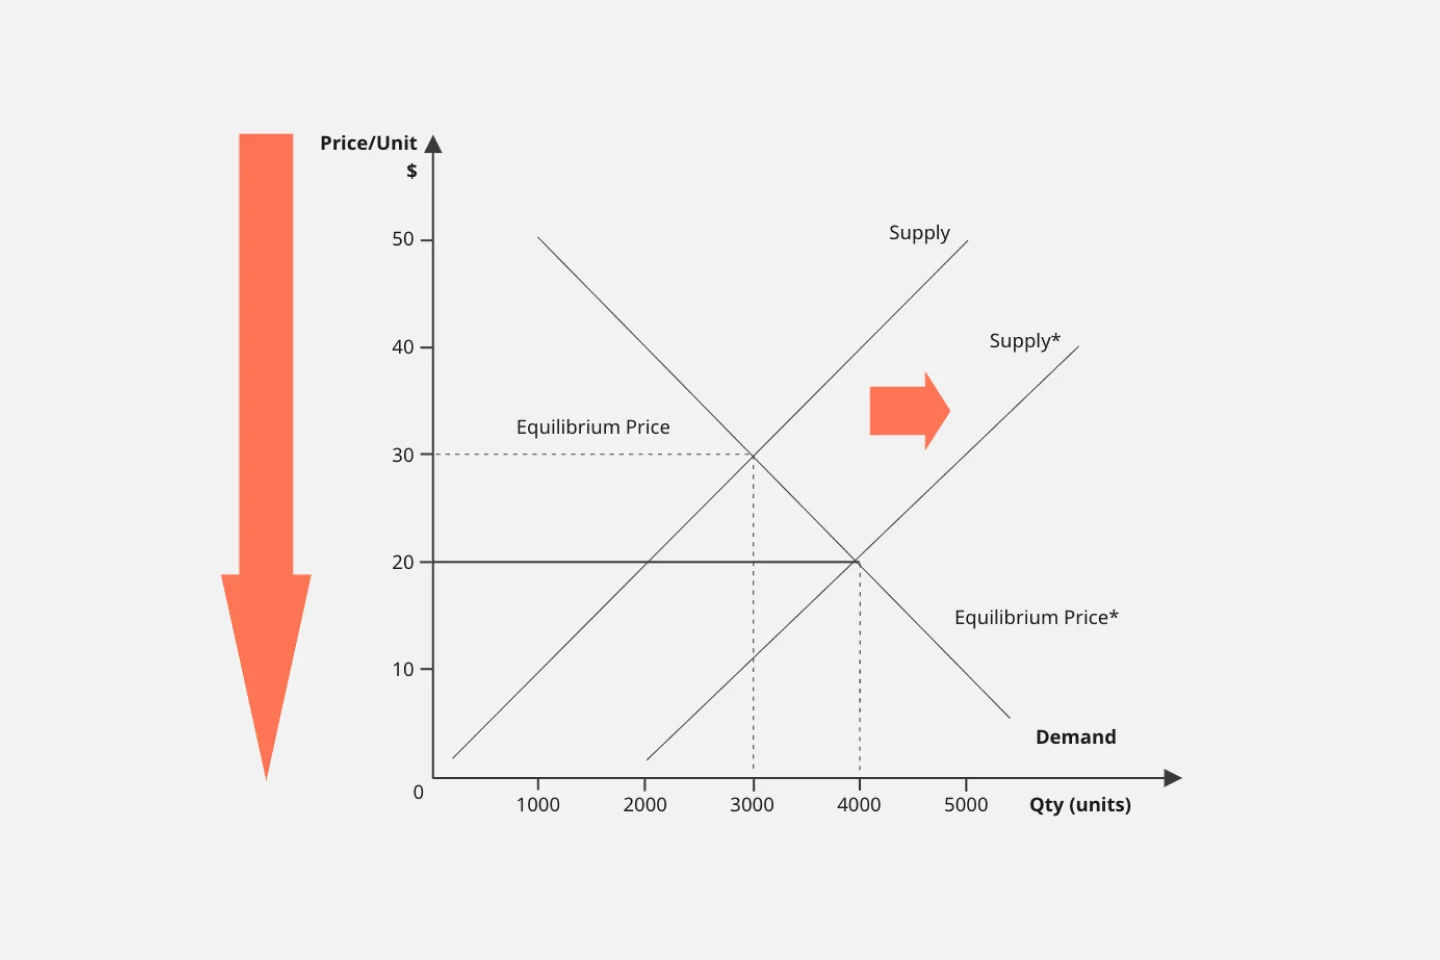
需要供給図テンプレート
活躍するシチュエーション:
マーケティング, マッピングとダイアグラム作成
Miroの需要供給図テンプレートを活用して、製品やサービスの適切な価格を決定することに役立てましょう。消費者にとって有益で、会社にとって収益性のある商品価格の設定方法を見つけることができます。
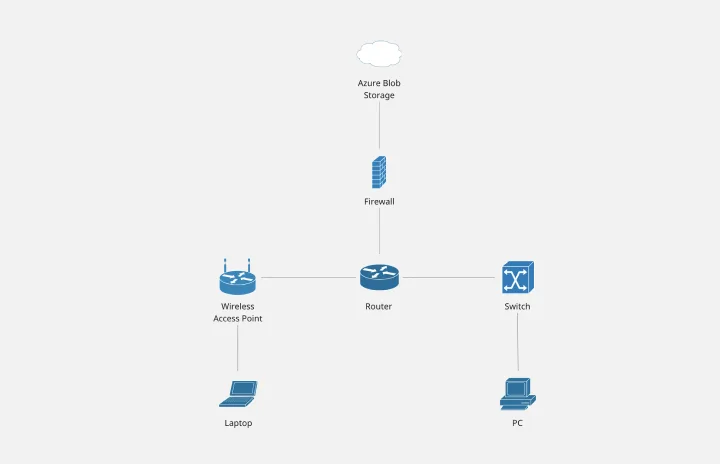
Cisco ネットワーク図テンプレート
活躍するシチュエーション:
ソフトウェア開発, 図表作成
Cisco のデータセンターとアクセスネットワークソリューションには、業界最高レベルの自動化、プログラム性、リアルタイムの可視性があり、スケールに合わせて構築されています。Cisco ネットワーク図は、Cisco 要素を使用して、Cisco のネットワークデザインを視覚化することに役立ちます。
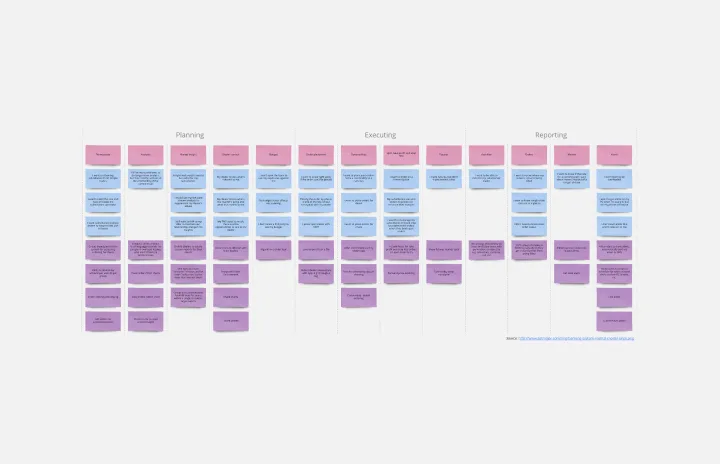
結果マッピングテンプレート
活躍するシチュエーション:
マッピング, 図表作成, プロジェクト管理
大規模で複雑なプロジェクトには、多くの固有の不確定要素があり、さまざまな結果が生じる可能性があります。そうしたあらゆる可能性にどう対処すればよいのでしょうか?可能性を予測することができます。結果マッピングは、プロジェクト進行中に発生する多くの変更や予測できない障害に備え、前もって情報を収集しておく手法です。このテンプレートを使用することで、準備作業、監視用フレームワークの提供、評価計画の作成、チームや関係者への周知の 4 つのステップで結果マッピングを簡単に実施することができます。
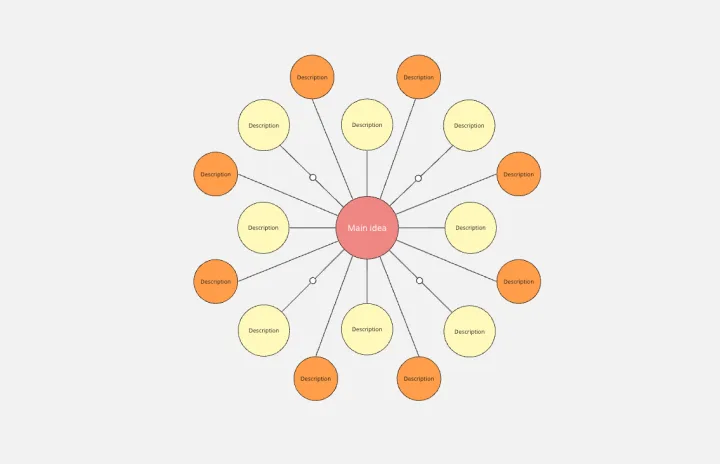
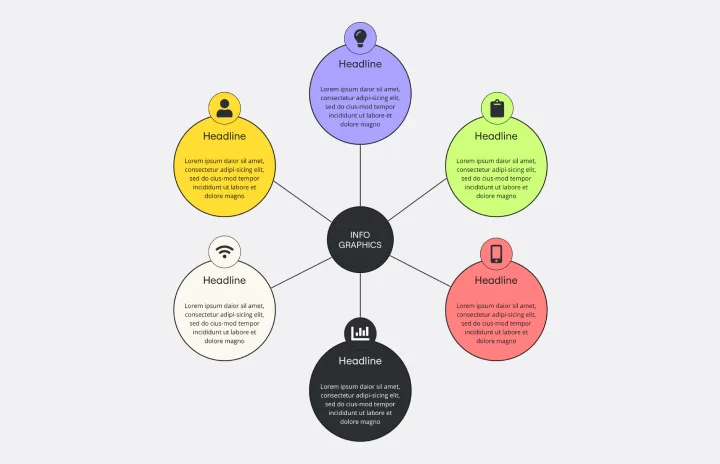
スパイダー図テンプレート
活躍するシチュエーション:
ダイアグラム作成, マッピングとダイアグラム作成
ブレインストーミングやプロジェクトの計画、アイデアの整理に Miro のスパイダー図が便利です。このテンプレートでは中心のアイデアから雲の足のようにアイデアを広げていき、関連するアイデアを可視化することができます。