Fishbone Diagram Template
Visualize the potential causes of a problem to solve it collaboratively using an Ishikawa Fishbone Diagram Template.
Trusted by 65M+ users and leading companies


About the Fishbone Diagram Template
The fishbone diagram template (also known as an Ishikawa fishbone template or a fishbone analysis template) is a ready-to-use template you can easily customize in Miro with your team. Filling in the template helps you quickly create a fishbone diagram — a visual tool for conducting root cause analysis. By exploring all of a problem’s possible causes, your team can use Miro’s fishbone template to identify underlying issues, anticipate consequences, target opportunities for improvement, and get on the same page about how to move forward.
How to create a fishbone diagram using Miro’s template
You can easily fill in Miro’s fishbone diagram template with your team — both in real-time and asynchronously. To get started, scroll to the top of this page and click on the blue “Use template” button. That’ll open the fishbone template up in Miro and allow you to start inviting any collaborators to join you on the board.
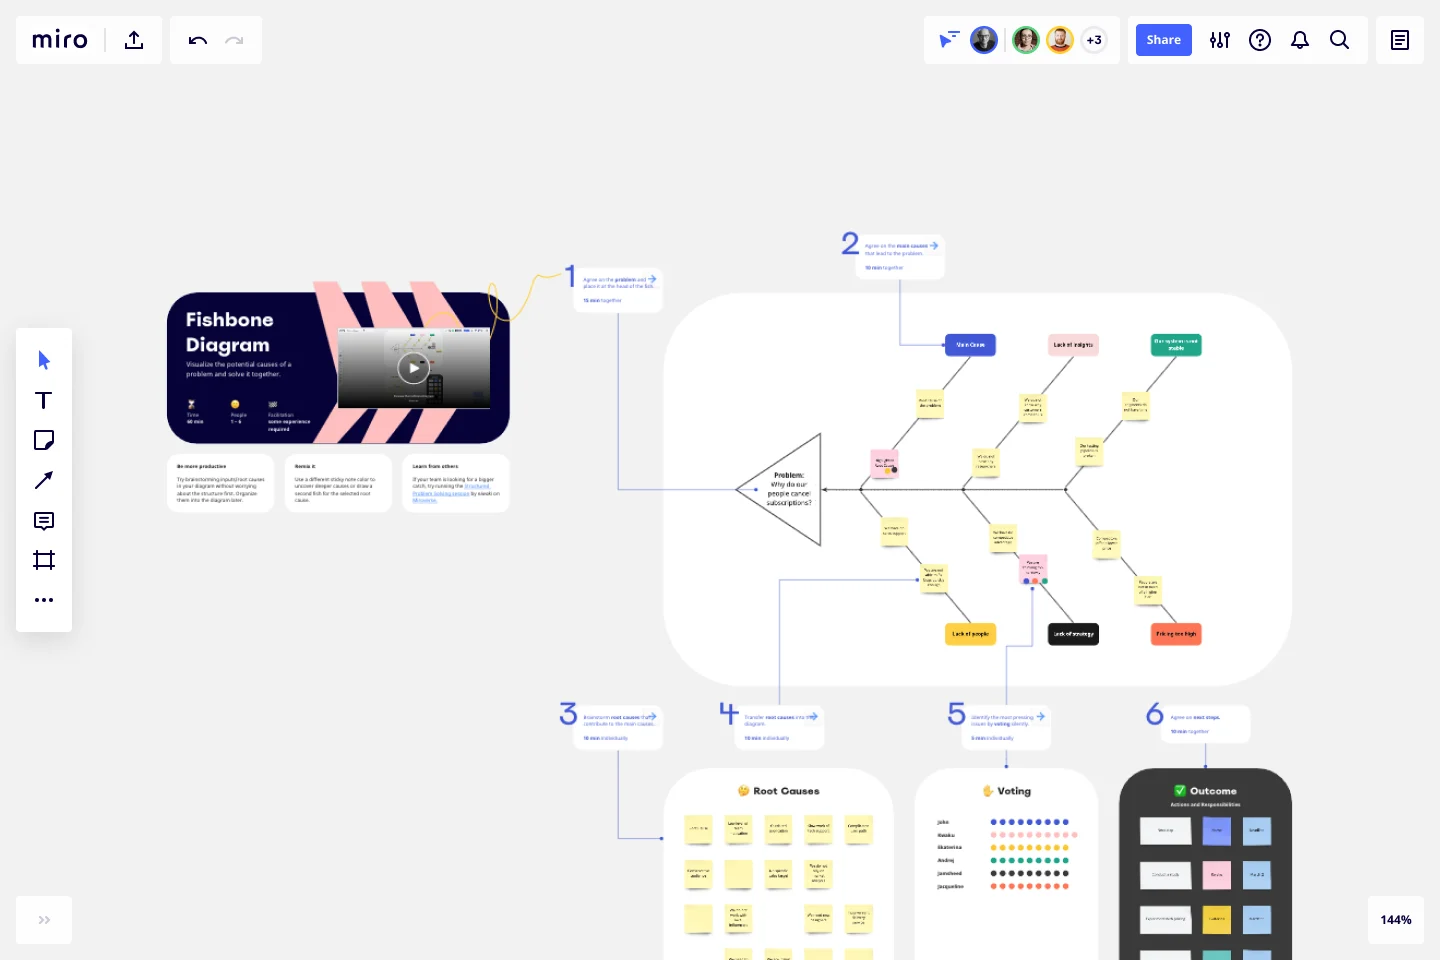
Once you’re in, you’ll notice that the fishbone diagram template is split into four main sections: the fishbone diagram itself, a brainstorming activity, a voting activity, and an opportunity to identify outcomes or next steps. As you move through each section, you’ll get closer and closer to identifying the root causes. So let’s talk about how to fill each section in.
Here are 5 steps to guide you through Miro’s fishbone diagram template:
1. Add the problem statement
Let’s start at the large triangle on the left-hand side of the fishbone diagram — the fish head. This is where we’ll state the overarching problem we’re trying to explore using the fishbone diagram template. You’ll notice that Miro’s template comes with pre-written text here. To replace the text with your own, simply double-click on it to start editing.
The statement in the fish head should clearly explain what the problem is, ideally including how and when it occurs. Make sure your team agrees on the problem statement – including how you’ve defined it – before filling out the rest of the fishbone analysis template. This first step should take you around 15 minutes.
2. Highlight the main causes
Let’s explore the main causes behind the problem. Remember, we’ll get to the root causes toward the end of completing the fishbone diagram template. Right now, just think of the immediate reasons behind the issue. For example, if you’re thinking about why a car won’t start, one main cause could be a dead battery. The reason the battery’s dead, to begin with, would be your root cause.
When you’ve identified a few main causes behind your problem, add them to the six colored rectangles with rounded corners — the ones along the edges of the fishbone diagram. Just double-click on the rectangle you want to edit and start adding your own text. This step should take you about 10 minutes.
3. Brainstorm root causes
Time to identify the root causes. To help you and your team get on the same page, scroll down on the fishbone diagram template to the section titled “root causes”. Take 10 minutes with your team to brainstorm several possible root causes behind your main causes, and write them down on the sticky notes. To keep track of time, use the built-in timer at the top of your Miro Board.
You can also complete this part of the fishbone diagram template using the 5 Whys framework, which helps you dig deeper into issues and uncover new potential causes. When you’re all done, click and drag your root causes onto the fishbone diagram and arrange them along the fishbones connected to the relevant main causes. To remove the fishbone template’s pre-filled sticky notes, click on them and press “delete” on your keyboard.
4. Vote on the most pressing issues
Now that you’ve identified both your main and root causes, vote on the issues that matter most to you with your team. Scroll to the section on the fishbone diagram template labeled “voting” and replace the pre-filled team names with your own. Start a 5-minute timer in your Miro Board, giving each of you time to drag your colored dots onto the sticky notes you want to vote for.
5. Agree on next steps
Time to wrap up your Ishikawa diagram. Head to the “Outcome” section of the fishbone template and talk to your team about the next steps. We’ve divided this section into three columns of sticky notes: next step, name, and deadline. Fill the sticky notes below each of these column headers to identify key action steps you’d like to take, who should be responsible for it, and when you’d like to get it done. Completing this section of the fishbone diagram template will help you mitigate your problem.
Tip: If you're solving a particularly complicated problem or need a more customizable space for root-cause analysis, jump into the fishbone diagram maker to build your own Ishikawa diagram from scratch.
Another approach worth keeping in mind when completing the fishbone template is the 6Ms of Production:
Manpower: Consider any labor issues
Methods: Consider any production and delivery issues
Machinery: Consider your infrastructure
Mother Nature: Consider any unpredictable and uncontrollable environmental issues
Materials: Consider raw materials, inputs, consumables
Measurement: Consider your current standards for measuring progress.
Benefits of using a fishbone diagram template
There are several advantages to using a fishbone analysis template. Here are a few to keep in mind:
Focus on a cause rather than symptoms
Using a fishbone diagram template helps you visualize multiple layers of causes behind a problem. It helps you go beyond a problem’s immediate reasons by exploring the causes behind them. For example, you might know that a car isn’t starting because its battery is dead. But understanding what caused the dead battery in the first place allows you to dig deeper into the situation.
See all potential causes at a glance
Because a fishbone template displays multiple layers of causes, it helps you and your team develop a big-picture view of the problem, allowing you to consider more long-term solutions instead of only resolving it temporarily. This isn’t just useful for you and your teammates but also for presenting to stakeholders and clients.
Get your team on the same page
Using a fishbone template requires careful thinking, which means it’s important to consider as many angles to your problem as possible. That’s where gathering your teammates isn’t just handy but also an ideal part of completing the fishbone diagram template. Getting multiple perspectives on a problem not only saves you time from having to identify its root cause yourself but allows you to arrive at one more accurately.
Fishbone diagram template example
Miro’s fishbone diagram template comes pre-filled with a clear example of how to use it to conduct a root cause analysis. In this example, the problem statement is: “Why do people cancel subscriptions to our platform?” You’ll find this statement in the fish head — the triangle on the far left of the fishbone diagram itself.
From here, it’s about identifying the main causes, which you’ll find in the colored rectangles along the edges of the fishbones:
Price too high
System not stable
Not enough staff
Lack of insights
Lack of strategy
Along the bones themselves, you’ll find the root causes behind these main problems. It’s crucial to complete this step thoroughly when conducting a fishbone diagram analysis. Each main cause we’ve identified in the fishbone template comes with a number of root causes. The root cause behind the main cause, “Price too high,” includes: “Competitors offer a lower price” and “People are not in need of a higher tier.”
This is just one way to use a fishbone diagram. Regardless of the problem you’re exploring in using the fishbone template, it’s all about understanding why the main causes exist in the first place.
Once you’ve completed the fishbone diagram, vote to identify what each team member believes is the root cause. After discussion and debate, the underlying causes should be much clearer.
When should I use a fishbone diagram template?
You can use Miro’s fishbone diagram template for any situation where you need to understand all of a problem’s contributing factors — such as when you’re looking to control product quality, improve customer services, or optimize project management workflows. Using Miro’s fishbone template, you’ll get to analyze a problem statement, assess ways to make improvements, and make the right changes.
What are the benefits of using Miro’s fishbone diagram template?
Miro’s template is more than a ready-to-use fishbone diagram. It’s designed to help you brainstorm root causes, vote on issues that matter most, and identify action steps on your way out — all on one infinite canvas. This helps you create an Ishikawa diagram as thoroughly and accurately as possible while establishing a clear sense of direction for your team. With real-time collaboration features, Miro makes it easy for your team to complete the fishbone template together online, even if you aren’t all in the same room. You can also use our built-in timer to stay on track and work efficiently.
How can I draw a fishbone diagram?
Kickstart your team’s problem-solving process with Miro’s ready-to-use fishbone diagram template. Want to build your own? You can also draw a fishbone diagram using shapes, connection lines, sticky notes, and text boxes — all on Miro’s infinite canvas. If you want inspiration for your fishbone diagram, explore more templates in Miroverse.
Get started with this template right now.
Website Flowchart Template
Works best for:
Flowcharts, Mapping, User Experience
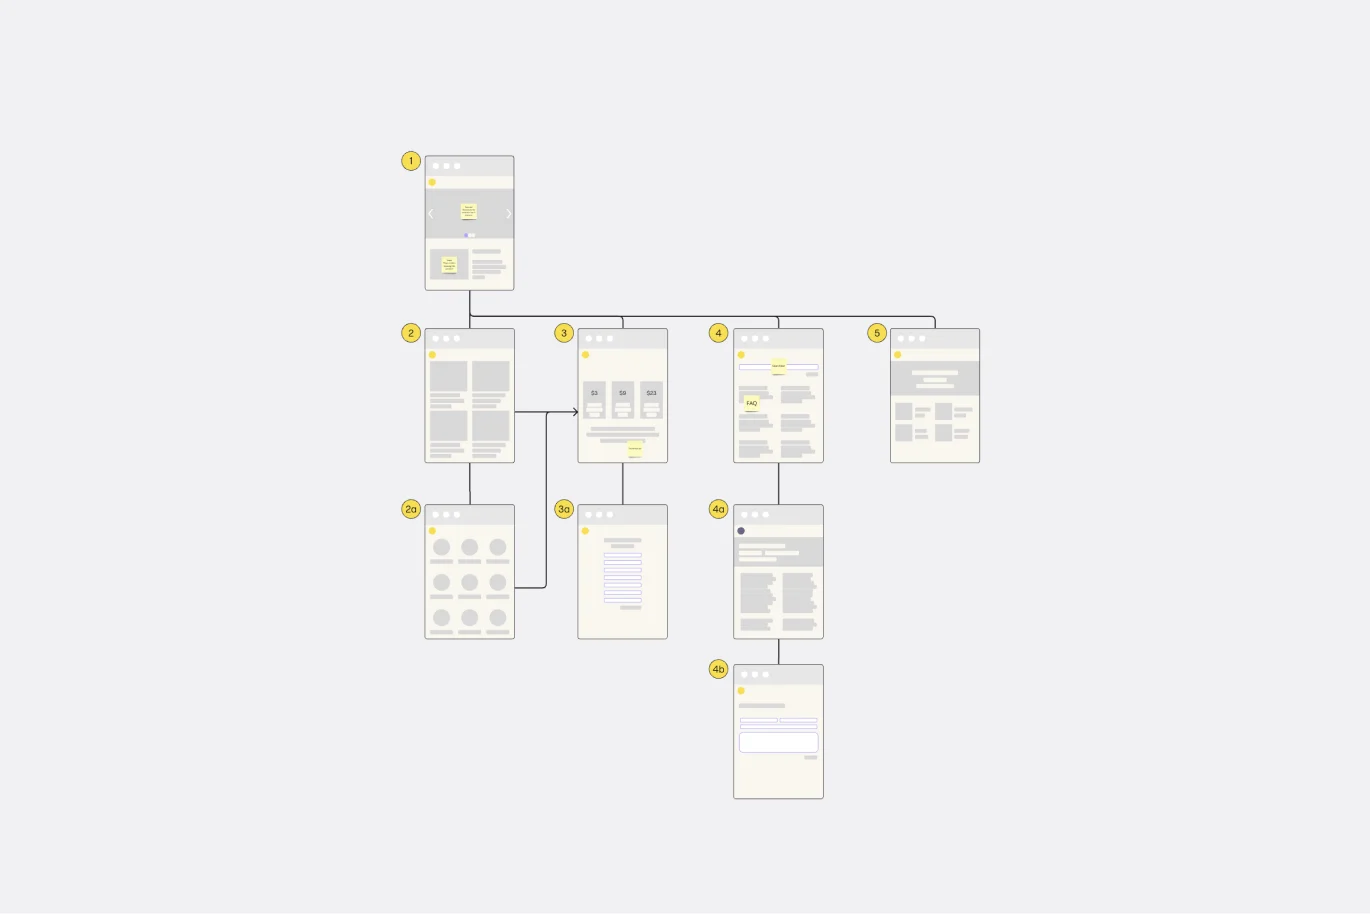
A website flowchart, also known as a sitemap, maps out the structure and complexity of any current or future website. The flowchart can also help your team identify knowledge gaps for future content. When you’re building a website, you want to ensure that each piece of content gives users accurate research results based on keywords associated with your web content. Product, UX, and content teams can use flowcharts or sitemaps to understand everything contained in a website, and plan to add or restructure content to improve a website’s user experience.
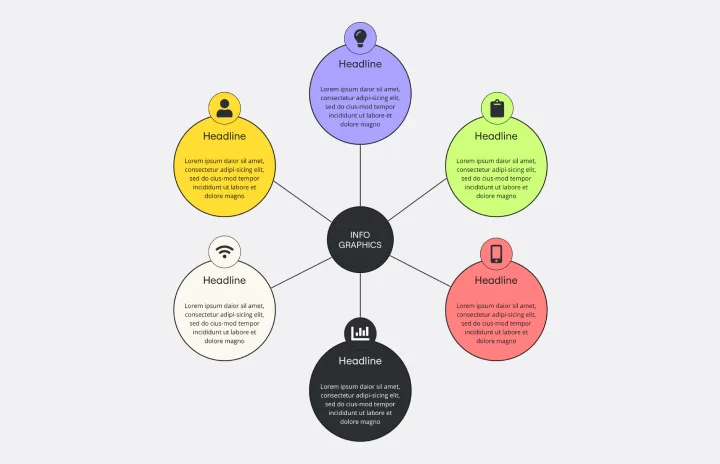
Web Diagram Template
Miro's Web Diagram Template simplifies complex project organization and promotes effective communication. It allows users to easily connect elements and gain a comprehensive understanding of complex relationships, making it a versatile and invaluable asset for diverse projects.
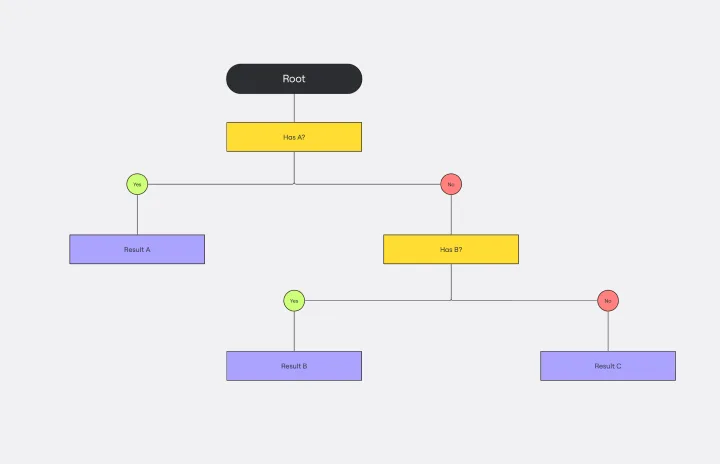
Dichotomous Key Template
Works best for:
Diagramming
The Dichotomous Key Template stands out as an exceptional tool for simplifying complex classification processes, significantly enhancing learning experiences. Breaking down intricate subjects into a series of binary decisions transforms how information is absorbed and understood. This systematic approach not only aids in retaining intricate details but also makes the learning process more engaging and interactive. Whether for educational purposes or professional use, the template’s design fosters a deeper comprehension of the subject matter, allowing learners and professionals to navigate complex scenarios with clarity and ease.
PERT Chart Template
Works best for:
Mapping, Diagrams, Project Planning
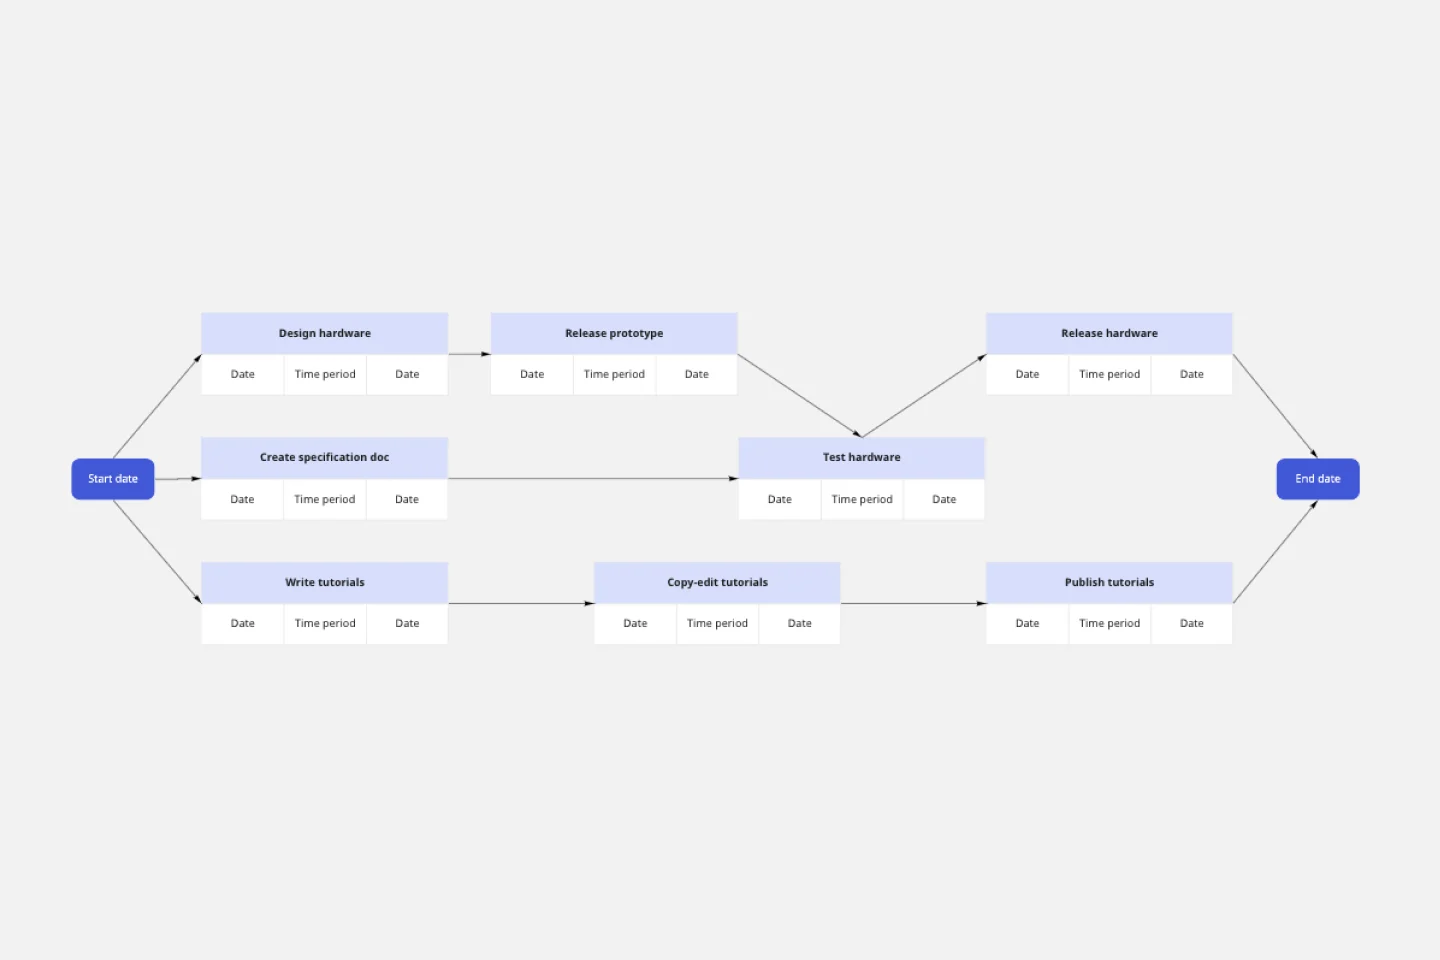
A Program Evaluation and Review Technique (PERT) diagram is used to plan projects efficiently. They help you set a clear timeline, plan out tasks and dependencies, and determine a critical path.
Use Case Diagram Template
Works best for:
Marketing, Market Research, Diagrams
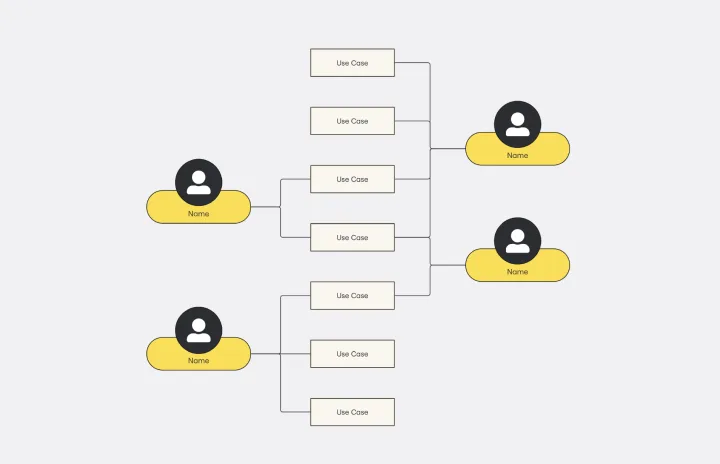
A use case diagram is a visual tool that helps you analyze the relationships between personas and use cases. Use case diagrams typically depict the expected behavior of the system: what will happen and when. A use case diagram is helpful because it allows you to design a system from the perspective of the end user. It’s a valuable tool for communicating your desired system behavior in the language of the user, by specifying all externally visible system behavior.
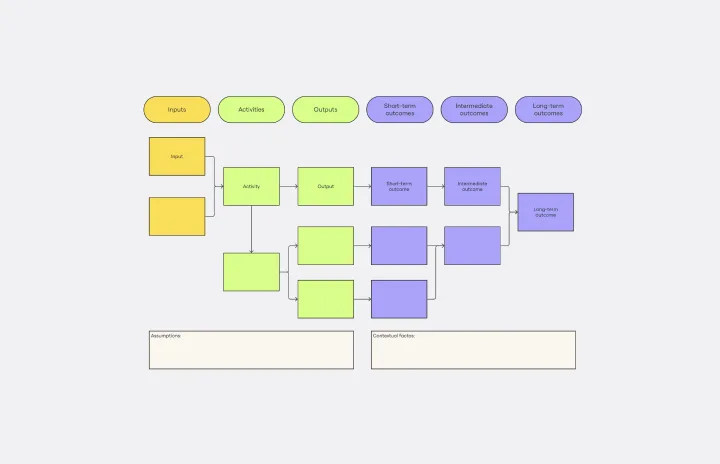
Logic Model Template
Works best for:
Diagramming
The logic model template is a strategic visual tool designed to delineate the relationship between a program's inputs, activities, outputs, and outcomes. By providing a clear and comprehensive map of the project lifecycle, stakeholders can swiftly grasp the intricate connections within a given initiative. One standout benefit of this template is its ability to enhance clarity: by visually representing the transformation of resources into anticipated results, teams can ensure more efficient and targeted use of their resources, thus maximizing the potential for success in their endeavors.