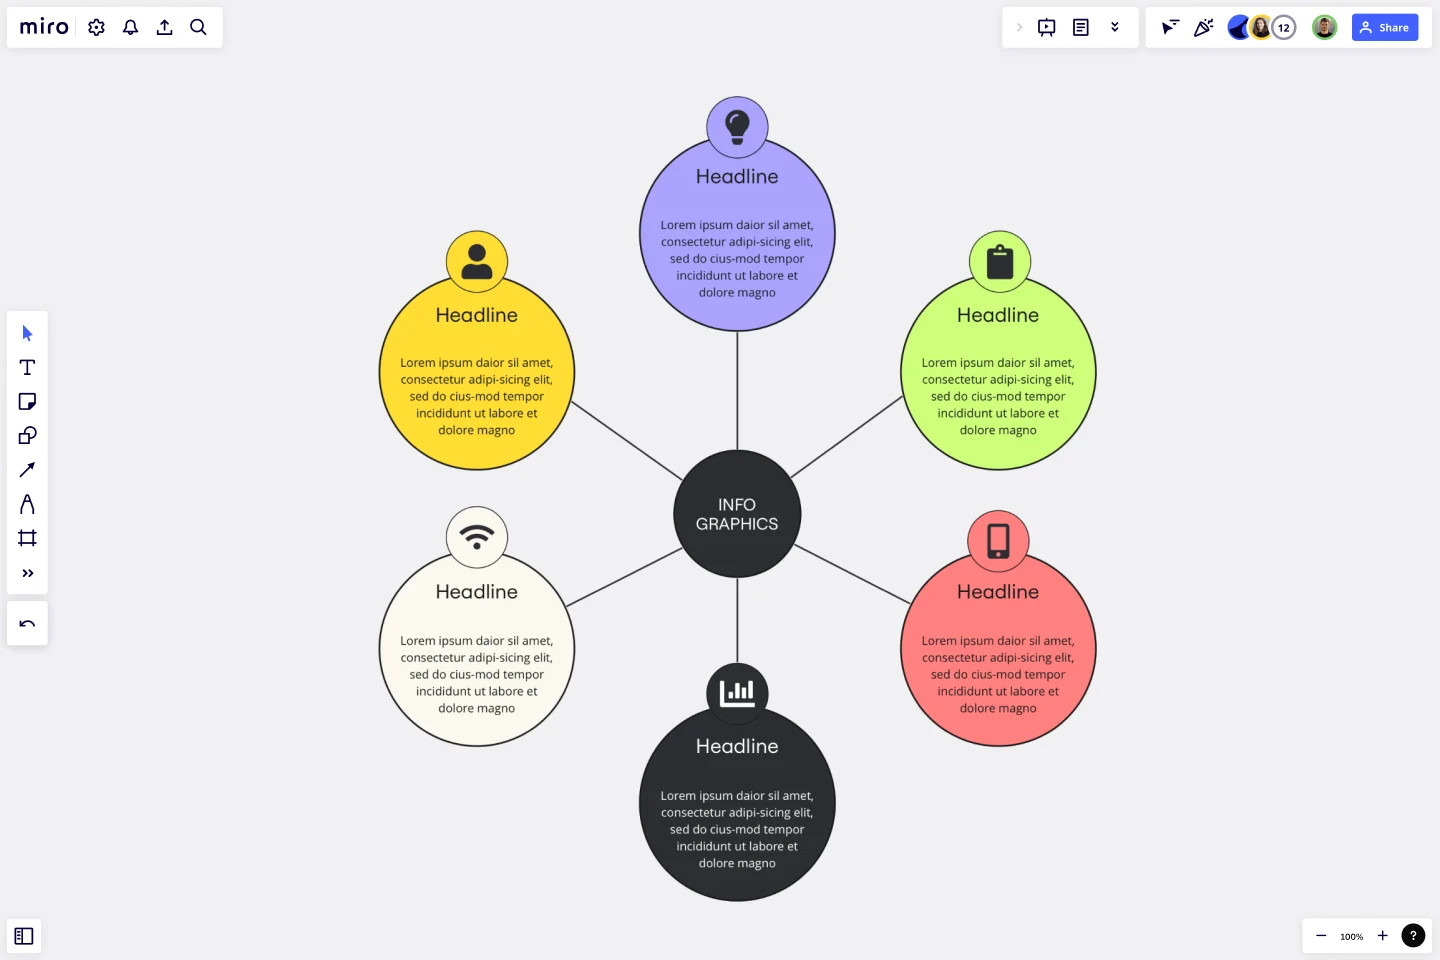
Web Diagram Template
Effortlessly interconnect elements and bring clarity to your ideas across diverse projects with the web diagram template.
Trusted by 65M+ users and leading companies


About the Web Diagram Template
The web diagram template is a useful visual tool that works like a spider diagram. It helps in connecting various elements to create a comprehensive visual story. Whether you are working on web projects, brainstorming sessions, or strategic planning, this template can help you explore and weave a network of ideas that is clear and coherent. It helps in presenting your concepts in a more organized and easy-to-understand manner.
Understanding the web diagram template
The web diagram template is an adaptable canvas that enables you to delineate relationships and connections among diverse elements, encouraging a comprehensive overview of your ideas. The template's flexibility makes it a valuable asset for various projects, allowing you to navigate complexities and showcase the intricate web of relationships inherent in any concept or strategy.
How to use the web diagram template in Miro
Easy editing: Customize your diagram easily by adding, removing, or repositioning elements. Miro's intuitive interface ensures seamless editing with just a few clicks.
Flexible diagram: As your project progresses, dynamically expand your diagram. The template accommodates the growth of your ideas, ensuring your interconnected web remains a vivid and accurate representation.
Add context: Enhance your diagram with contextual artifacts such as notes, comments, or attachments. This adds depth and clarity, ensuring your visual narrative is informative and interconnected.
Why should you use a web diagram template?
Clear relationships: Demonstrate the connections between different elements to help you better understand your concepts.
Flexible: It can be applied to various scenarios where interconnectedness is essential.
Efficient creation: Use Miro's automated diagramming tools to save time and effort while creating your interconnected web.
Collaborative space: Foster a collaborative environment where team members can contribute and provide insights into the interconnected nature of your ideas.
Adaptability: Navigate through the complexity of any project, adapting your interconnected web as it evolves to ensure relevance and accuracy.
Can I collaborate in real-time on the web diagram with team members?
Yes, Miro's real-time collaboration features allow multiple users to work seamlessly on the same diagram, fostering teamwork and shared insights.
How does the web diagram template maintain clarity as the diagram expands?
Miro's automated diagramming features intelligently adjust as you expand your interconnected web, ensuring that clarity is maintained throughout the evolution of your visual narrative.
Get started with this template right now.

20/80 Process Diagram - EOS Compatible
Works best for:
Diagramming
The 20/80 Process Diagram - EOS® Compatible template is a visual tool for mapping out processes and workflows aligned with the Entrepreneurial Operating System (EOS®) methodology. It provides a structured framework for identifying core processes and key activities that drive business outcomes. This template enables organizations to streamline operations, clarify roles and responsibilities, and enhance accountability. By promoting alignment with EOS® principles, the 20/80 Process Diagram empowers teams to achieve organizational excellence and drive sustainable growth.

Force Field Analysis Template
Works best for:
Diagramming, Strategic Planning
A Force Field Analysis Template is a powerful tool that helps teams identify and analyze the forces supporting or hindering progress toward a specific change or goal. This template provides a visual space where you can brainstorm and plot out 'driving forces' that push objectives forward and 'restraining forces' that prevent advancement, all on a single, intuitive board. One of the primary benefits of utilizing the Force Field Analysis template is that it fosters a shared understanding among team members. By visually mapping out and discussing each force, teams can prioritize efforts, build consensus on the central issues to tackle, and collaboratively devise strategic plans to strengthen positive influences while reducing negative ones.
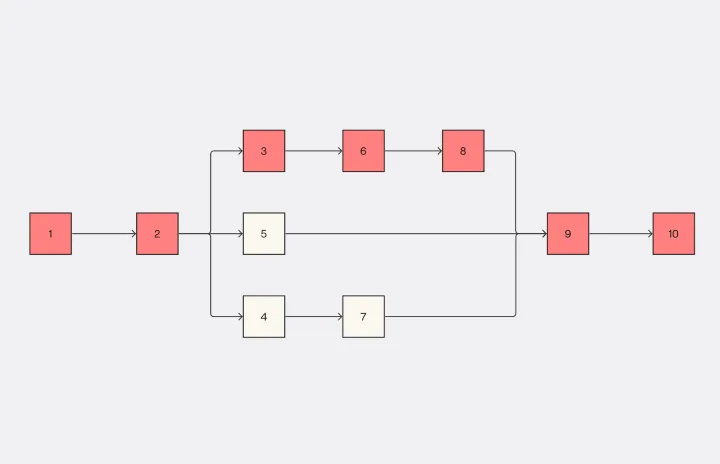
Critical Path Method Template
Works best for:
Diagramming, Project Management
Elevate your project management game with the Critical Path Method Template—an indispensable tool that brings clarity and precision to your project timelines. The template instantaneously adjusts as you edit tasks and dependencies, ensuring that your critical path is consistently up-to-date. This capability not only simplifies the complex process of project scheduling but also empowers your team to proactively respond to evolving project dynamics, fostering adaptability and efficiency throughout the project lifecycle.
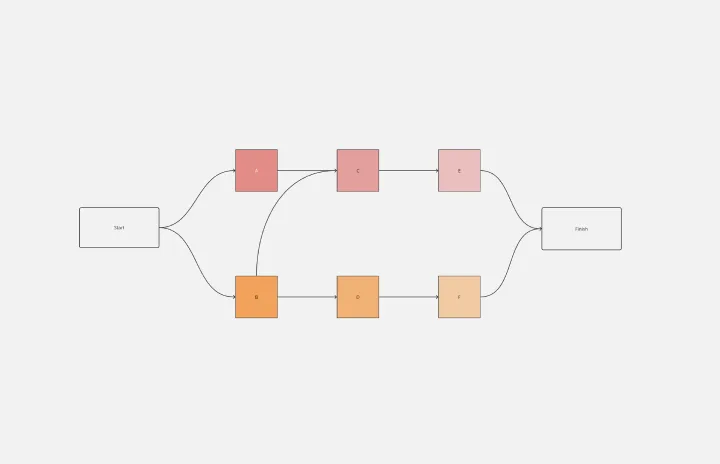
Precedence Diagram
Works best for:
Diagramming, Mapping
The Precedence Diagram Template offers a visual tool that maps out project activities and their interrelated sequences. This diagram empowers teams to recognize and anticipate workflow structures by illustrating the connections and dependencies among tasks.
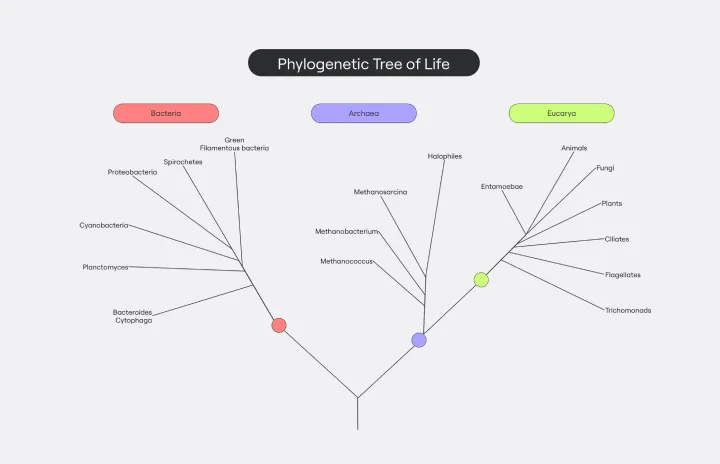
Phylogenetic Tree Template
Works best for:
Diagramming
The Phylogenetic Tree Template is a powerful tool that allows scientists and researchers to visualize evolutionary relationships between species. It is a visual representation of the history of the evolution of life on Earth and helps users identify the relationships between other organisms and their ancestors. The key benefit of this template is that it organizes complex data and makes it more understandable to everyone. Additionally, it offers an efficient way to collect and analyze data, saving time and effort and enabling users to identify significant patterns and relationships in the data.

Production Flowchart Template
Works best for:
Flowcharts
The Production Flowchart Template is a well-crafted tool that clearly represents a production process from start to finish. It breaks down complex procedures into easy-to-understand segments, making it easier for stakeholders to grasp the entire process. One of the key benefits of using this template is that it helps to clarify complex production pathways. By mapping out operations visually, teams can identify potential bottlenecks or inefficiencies, facilitating timely and well-informed decision-making.