Dichotomous Key Template
Enhance learning, classification accuracy, and collaborative efforts with the dichotomous key template.
Trusted by 65M+ users and leading companies


About the Dichotomous Key Template
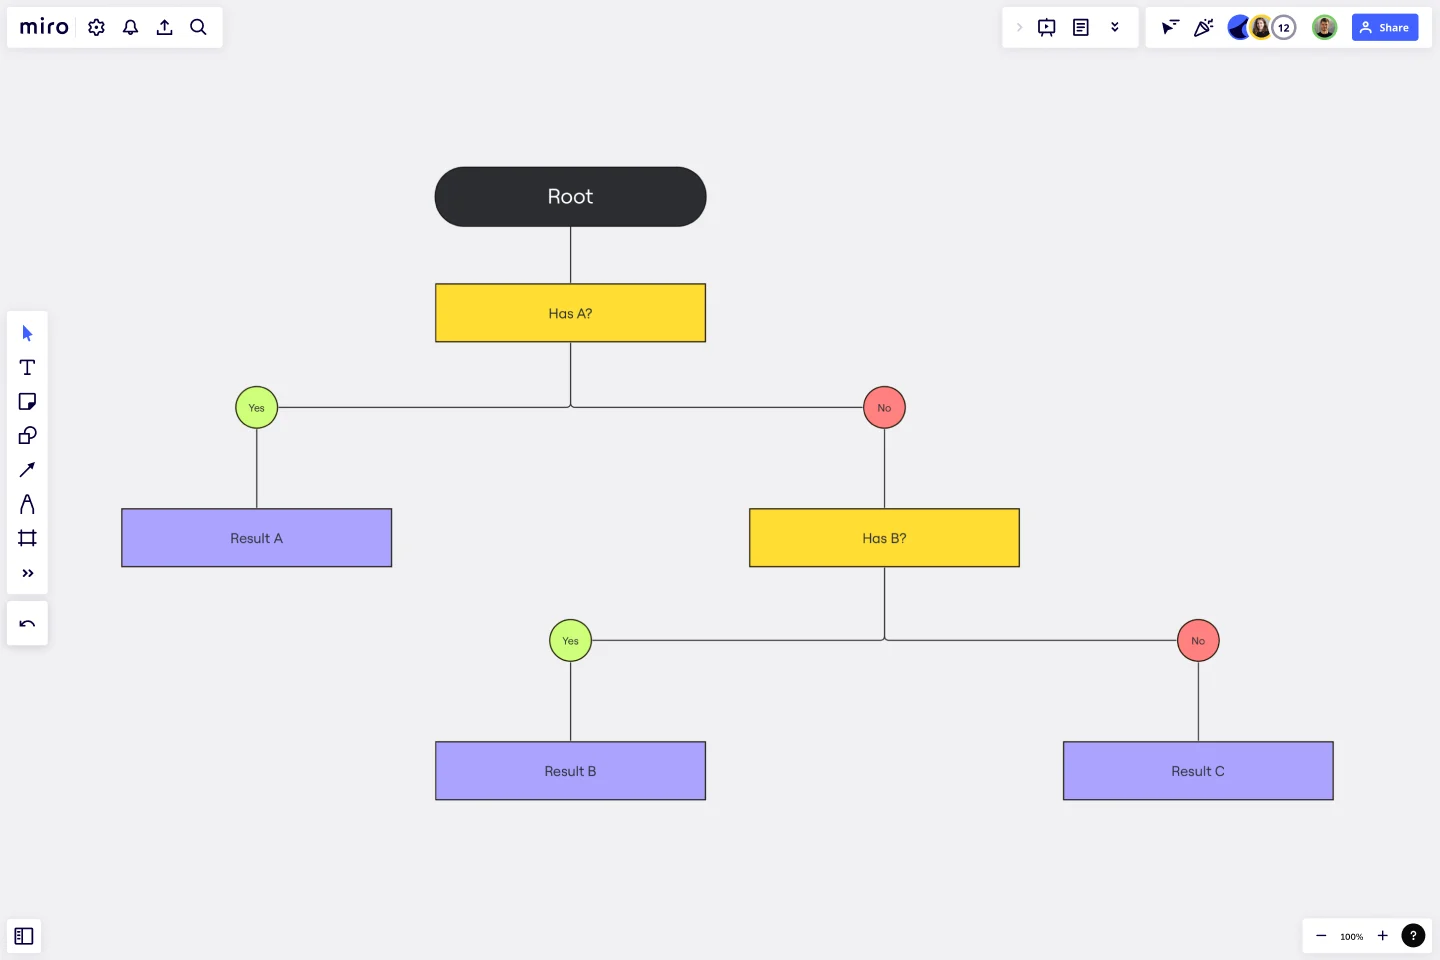
When dealing with complex subjects, a methodical and analytical approach is often necessary to unlock their mysteries. The dichotomous key template is a tool that simplifies these complexities by providing a step-by-step methodology to distinguish and categorize items based on a series of choices. This template is an invaluable educational and analytical tool that serves as an interactive guide through the maze of similar-looking entities. It can be used in biology for species identification or in any discipline that benefits from binary decisions.
How to use the dichotomous key template in Miro
Start with the basics: Open the template and begin by labeling the first decision point with a clear, concise question.
Make it your own: Click to edit any text box to enter questions and outcomes that are relevant to your subject matter.
Expand your key: If your content requires additional branches, simply drag and drop shapes or lines from the toolbar to extend the decision path.
Automate diagramming: Utilize automated diagramming features to maintain a clean, organized layout as your key grows in complexity.
Add context: Integrate images, links, or other artifacts by placing them onto your board to give deeper context to each decision point.
Editing and customizing the template is a breeze. Within a few clicks, the framework can be tailored to suit a wide array of scenarios while maintaining a clear and navigable structure.
Why should you use a dichotomous key template?
Enhance learning: It offers an interactive way to engage with material, making learning fun and more effective.
Improve accuracy: Breaking down complex identifications into simple yes/no questions minimizes errors.
Save time: It streamlines the process of categorization, allowing for quick decision-making.
Flexibility: Whether for educational purposes or to streamline workflow, the template is versatile and can be adapted to any set of criteria.
Collaborative: It supports collaborative efforts, allowing teams to contribute to and view the decision-making process in real time.
If you prefer to start from scratch, Miro's diagramming capabilities and tree diagram builder can help you create a dichotomous key in no time. Collaborate with others in real-time or async as you build out your dichotomous key.
Can the dichotomous key template handle more than biological classifications?
Absolutely. While traditionally used in biology, the template is designed to be a versatile tool for any categorization or decision-making process.
Is the template suitable for team collaboration?
Yes, the template supports real-time collaboration, making it perfect for teams to work together in mapping out decision trees and categorization keys.
How do I know if my dichotomous key is complete?
A key is complete when each branch leads to a conclusive outcome and all items have been classified without ambiguity.
What if I need to revise my dichotomous key?
The template is fully editable. You can easily adjust the questions, add branches, or refine the outcomes as your understanding of the categorized items evolves.
Get started with this template right now.

Value Stream Mapping Template
Works best for:
Project Management, Strategic Planning, Mapping
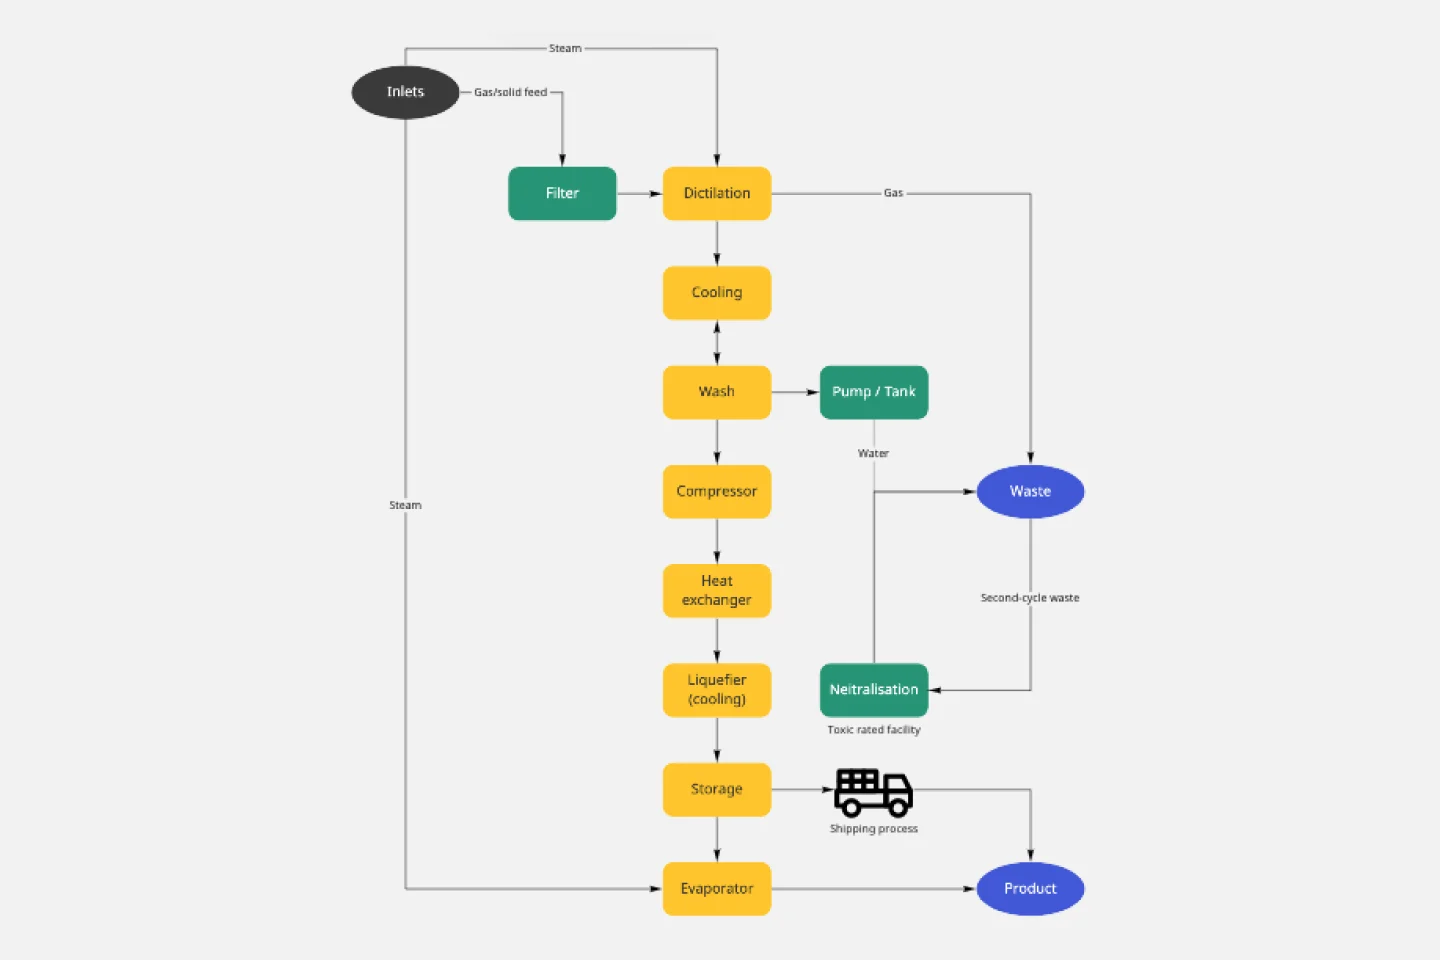
A value stream map can help you refocus your business on steps that actually provide value to your customers, cutting out wasteful and inefficient processes. With this template, you and your process team can collaborate on a value stream map today.
Bubble Map Template
Works best for:
Diagramming, Mapping, Brainstorming
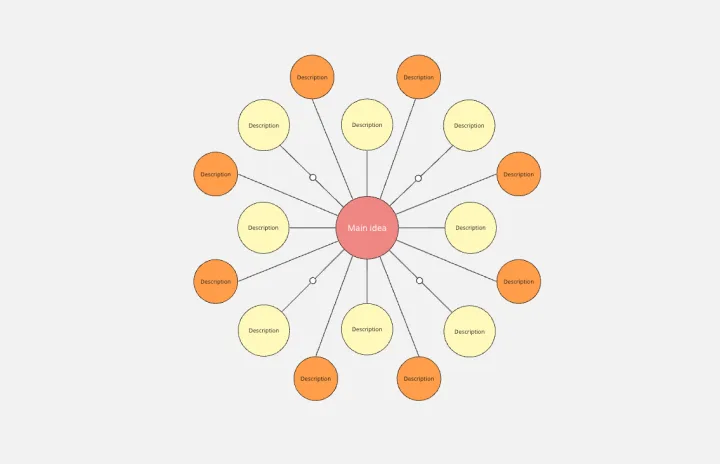
A Bubble Map Template is a visual organization tool that uses bubbles or circles to represent various ideas or data points. These bubbles are linked together, displaying their relationships and creating a network of interconnected thoughts. Use a Bubble Map Template to streamline complex information, enhancing comprehension and promoting efficient decision-making.
Block Diagram Template
Works best for:
Mapping, Software Development, Diagrams
Use this template to illustrate technical systems. Blocks represent important objects in the system, and arrows demonstrate how the objects relate to each other. Perfect for engineers, workflow managers, or anyone trying to build a better process.

Azure Demand Forecasting Template
Works best for:
Software Development, Diagrams
The Azure Demand Forecasting diagram will show the architecture of a demand forecast, making it easier for you to predict data consumption, costs, and forecast results. Azure is Microsoft’s cloud computing platform, designed to provide cloud-based services such as remote storage, database hosting, and centralized account management. Azure also offers new capabilities like AI and the Internet of Things (IoT).
Genogram Template
Works best for:
Diagramming
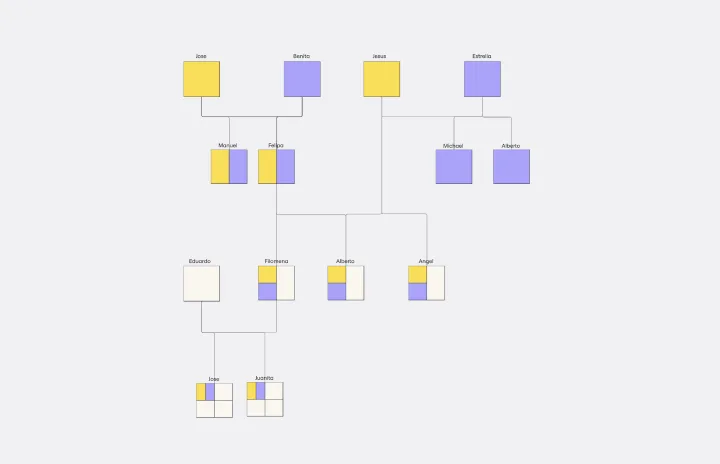
The Genogram Template maps out family structures and relationships with exceptional depth and detail. Unlike traditional family trees, this template provides a comprehensive perspective by encapsulating familial connections, emotional ties, and significant life events. Create a genogram to unearth patterns and trends within a family, whether hereditary or environmental. Professionals across different domains can gain a holistic understanding of familial dynamics by showing deep insights into the nuances of relationships, facilitating better communication and problem-solving.
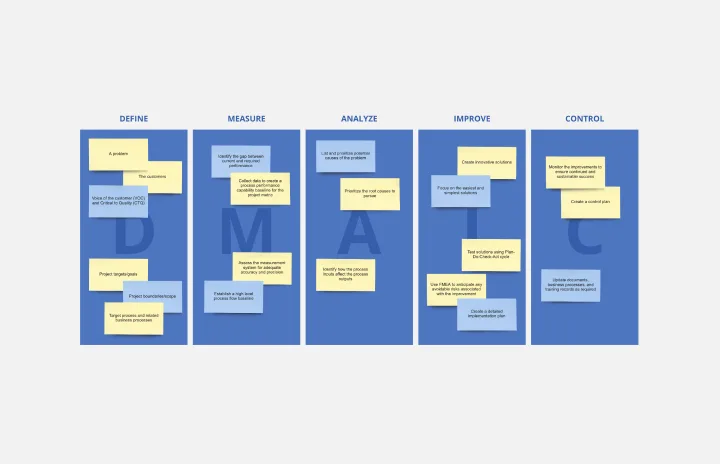
DMAIC Analysis Template
Works best for:
Agile Methodology, Design Thinking, Operations
Processes might not seem like the funnest thing to dive into and examine, but wow can it pay off—a more efficient process can lead to serious cost savings and a better product. That’s what DMAIC analysis does. Developed as part of the Six Sigma initiative, DMAIC is a data-driven quality strategy for streamlining processes and resolving issues. The technique is broken into five fundamental steps that are followed in order: Define, Measure, Analyze, Improve, and Control.