Business Intelligence Architecture Template
Simplify complex data structures with the business intelligence architecture template. Visualize data sources, warehouses, ETL processes, tools, and interfaces with ease.
Trusted by 65M+ users and leading companies


About the Business Intelligence Architecture Template
The Business Intelligence Architecture Diagram Template is a useful tool for creating visual representations of complex data structures and processes in a business intelligence system. This template is designed to meet the needs of IT professionals, data analysts, and business strategists, allowing them to communicate complex ideas effectively and promote better collaboration among team members.
Understanding the template
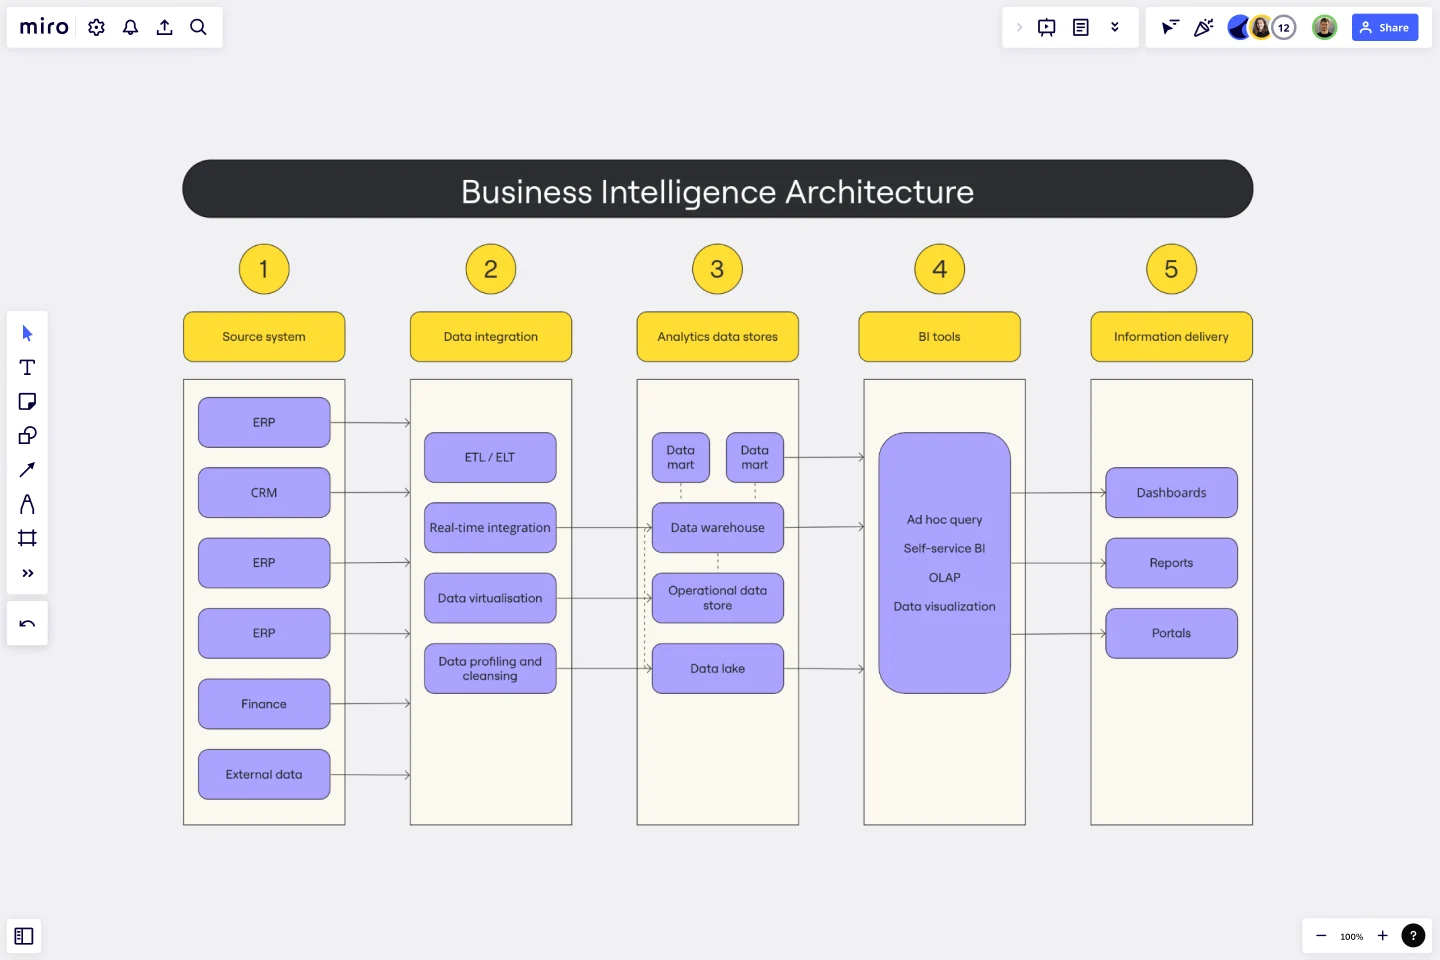
The business intelligence architecture template is usually divided into key areas, with the role of each component explained.
Data sources: This refers to the various databases and external APIs that contribute to the business intelligence system, providing different data inputs for analysis.
Data warehouse: It is the centralized repository where data is stored and organized in a structured format for easier retrieval and analysis.
ETL process: This process involves three main phases - extraction, transformation, and loading - to convert raw data into a usable format that can be analyzed and stored in the data warehouse.
Business intelligence tools: These are software and tools that help with data analysis, reporting, and visualization, providing a comprehensive view of the technological landscape.
Reporting and dashboards: This refers to the end-user interface, which includes reports and dashboards that offer a clear and user-friendly overview of the analyzed data.
How to use the business intelligence architecture template in Miro
Customize the template easily by using the drag-and-drop feature. This will help you represent your specific architecture seamlessly and with precision.
Miro's automated diagramming feature allows you to expand the template dynamically. This ensures that your diagram stays current with minimal manual intervention.
You can enhance the depth of your diagram by integrating relevant artifacts such as notes, comments, or links onto the Miro board. This provides additional context for your team.
Why should you use a business intelligence architecture Template?
Simplify complex concepts to enhance understanding and communication within the team. Encourage efficient collaboration among team members.
Collaboration is made easier with a visual roadmap, which helps prevent misunderstandings and facilitates decision-making, saving time.
Save time on project planning with professional diagrams.
Miro's automated diagramming features help businesses adapt effortlessly to evolving intelligence landscapes.
Can I customize the colors and shapes in the template?
The template is entirely customizable. Users can change colors, shapes, and labels to align with their preferences and organizational standards.
How frequently should I update my business intelligence architecture diagram?
Regular updates are advisable, particularly when changes occur in data sources, tools, or processes, ensuring the diagram accurately reflects the current state of the business intelligence system.
Get started with this template right now.

Production Flowchart Template
Works best for:
Flowcharts
The Production Flowchart Template is a well-crafted tool that clearly represents a production process from start to finish. It breaks down complex procedures into easy-to-understand segments, making it easier for stakeholders to grasp the entire process. One of the key benefits of using this template is that it helps to clarify complex production pathways. By mapping out operations visually, teams can identify potential bottlenecks or inefficiencies, facilitating timely and well-informed decision-making.
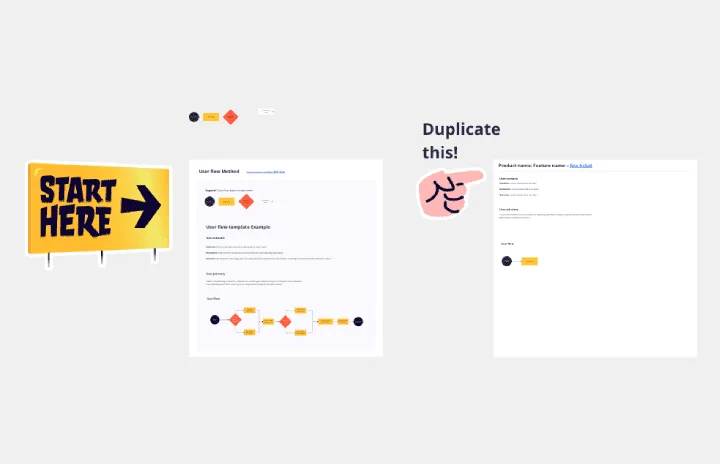
User Flow Example
Works best for:
Flowcharts, Mapping, Diagrams
The User Flow Example template offers a visual representation of a typical user flow within a digital product or service. It provides elements for documenting user interactions, navigation paths, and decision points along the user journey. This template enables UX designers and product teams to understand user behavior, identify pain points, and optimize the user experience. By providing a concrete example of user flow, the User Flow Example template serves as a valuable reference for designing intuitive and engaging digital experiences that meet user needs effectively.
SDLC Template
Works best for:
Diagramming
The Software Development Life Cycle (SDLC) template is a well-designed visual tool that helps software development teams follow a structured approach from the initial concept to the final deployment of the software. One of the most significant benefits of using this template is that it promotes clear, streamlined communication among team members. By breaking the development cycle into distinct phases, all stakeholders can stay informed about the progress of the project and understand their responsibilities within the larger context. This enhanced communication reduces the chances of misunderstandings and ensures that everyone works together towards the common goal of delivering high-quality software. The template acts not only as a roadmap but also as a shared language for the team, improving collaboration and the efficient progression of the project through each critical stage.
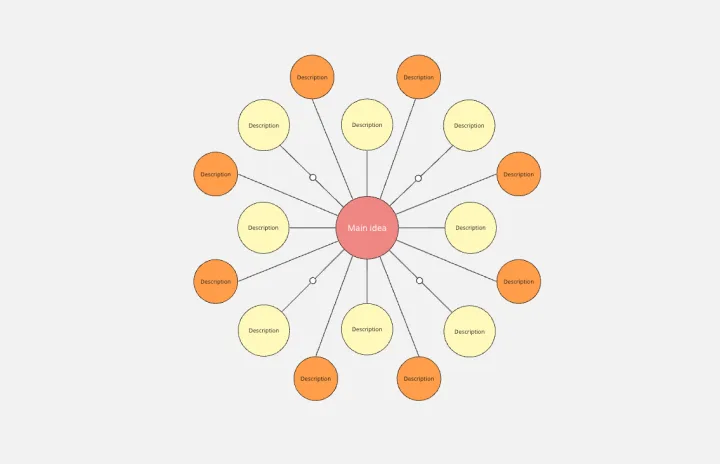
Bubble Map Template
Works best for:
Diagramming, Mapping, Brainstorming
A Bubble Map Template is a visual organization tool that uses bubbles or circles to represent various ideas or data points. These bubbles are linked together, displaying their relationships and creating a network of interconnected thoughts. Use a Bubble Map Template to streamline complex information, enhancing comprehension and promoting efficient decision-making.

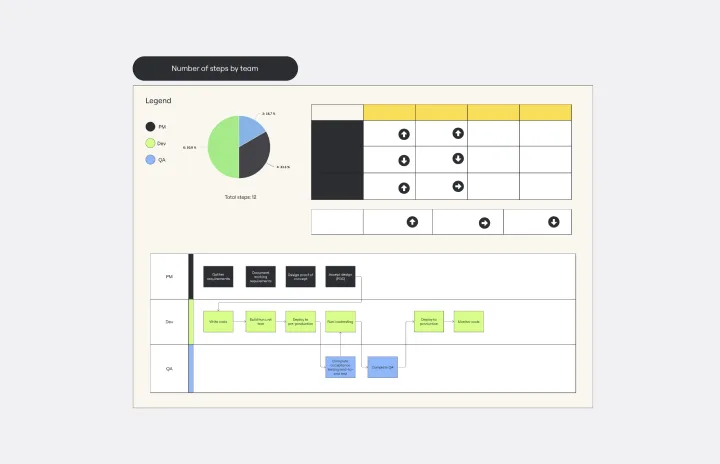
20/80 Process Diagram - EOS Compatible
Works best for:
Diagramming
The 20/80 Process Diagram - EOS® Compatible template is a visual tool for mapping out processes and workflows aligned with the Entrepreneurial Operating System (EOS®) methodology. It provides a structured framework for identifying core processes and key activities that drive business outcomes. This template enables organizations to streamline operations, clarify roles and responsibilities, and enhance accountability. By promoting alignment with EOS® principles, the 20/80 Process Diagram empowers teams to achieve organizational excellence and drive sustainable growth.
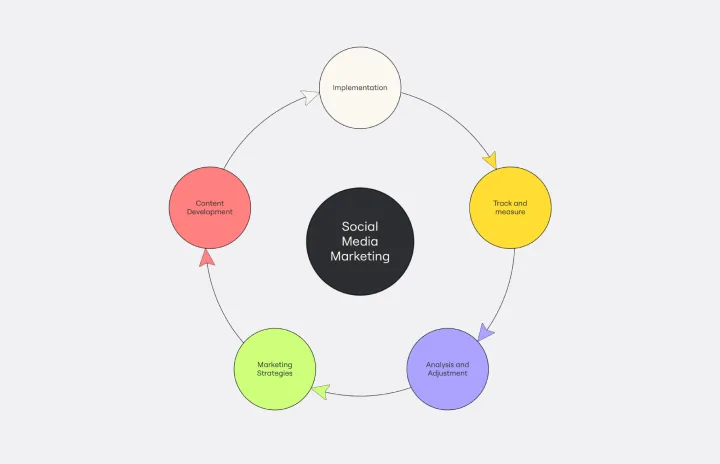
Cycle Diagram Template
Works best for:
Diagramming
The cycle diagram template empowers professionals to visually represent complex cycles with precision and clarity. This template maps out cyclical processes, relationships, or events, ensuring that complex concepts are communicated seamlessly. One key benefit that sets this template apart is its ability to streamline communication and enhance understanding. By crafting visually appealing cycle diagrams, professionals can distill complex information into a clear visual language, making it easier for teams and stakeholders to grasp complex relationships. This ultimately fosters more effective collaboration and decision-making.