Force Field Analysis Template
Identify driving and restraining forces, prioritize actions, and build team consensus for effective decision-making with the force field analysis template.
Trusted by 65M+ users and leading companies


About the Force Field Analysis Template
Force Field Analysis is a powerful tool that can help you identify and analyze the various factors that can impact the success of a project or initiative. The force field analysis template is a great way to get started with this technique, allowing you to quickly visualize and organize your thoughts in a collaborative and dynamic way.
What is the force field analysis template?
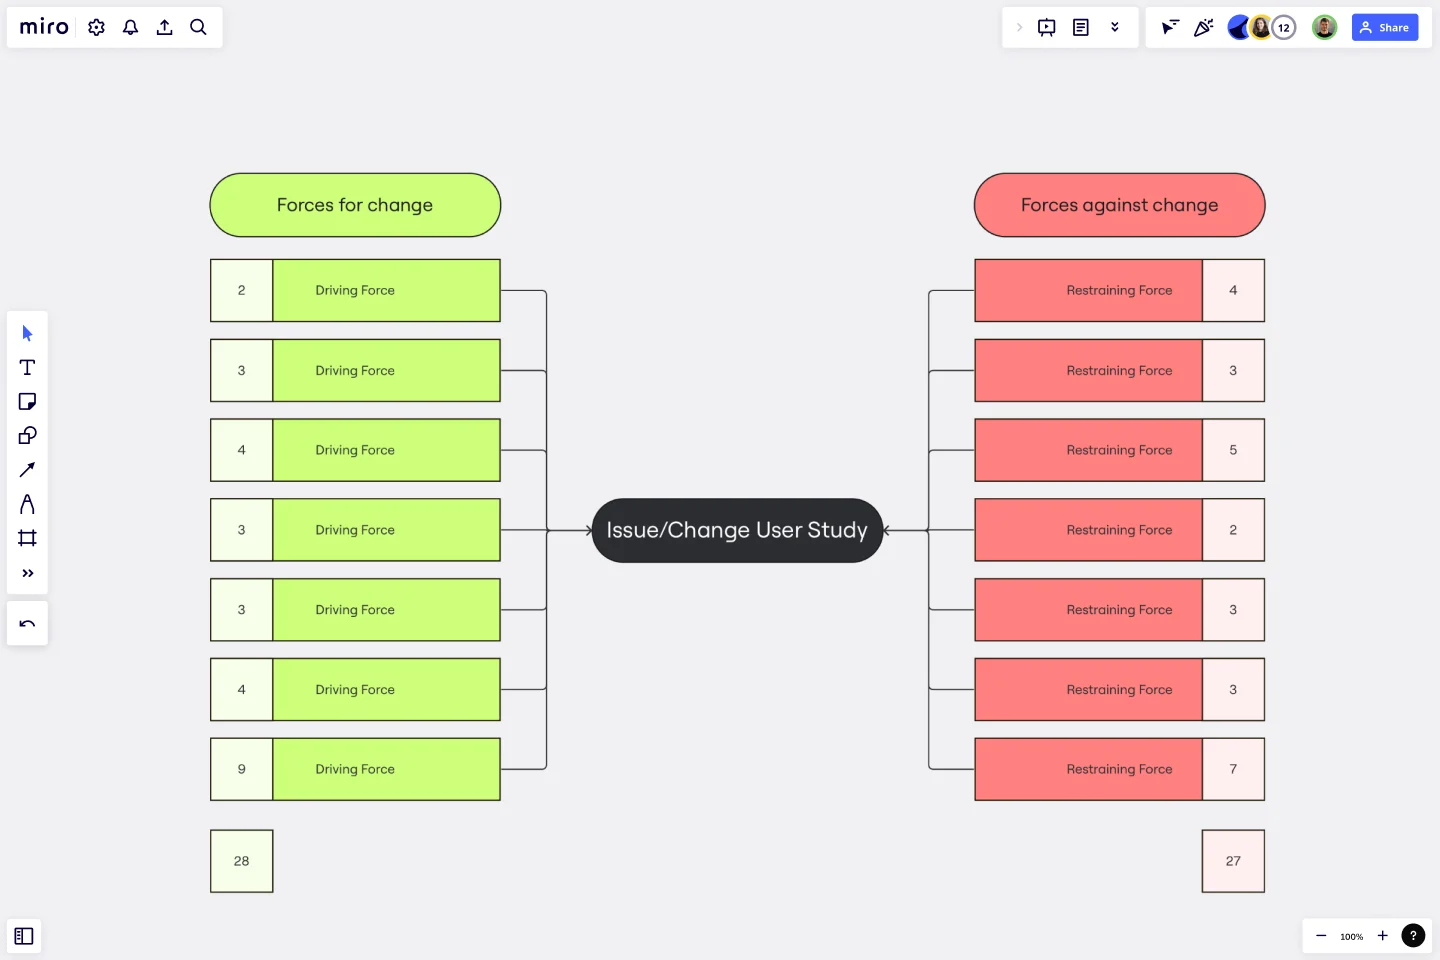
The force field analysis template is a simple yet effective way to understand and analyze the forces that can influence the success of your project. It consists of two main areas - driving forces and restraining forces - which can be broken down into more specific factors.
For example, driving forces might include factors such as increased revenue, improved customer satisfaction, or enhanced productivity, while restraining forces might include factors such as increased competition, budget constraints, or lack of resources.
How to use the force field analysis template in Miro
Here are the steps to use the Force Field Analysis template in Miro:
Open the template in your Miro board.
Start editing the template by adding or removing shapes and connector lines.
Use automated diagramming features to expand the template as needed.
Add any artifact on a Miro board to provide more context to your analysis.
Why should you use a force field analysis template?
There are many benefits to making a force field analysis, including:
Increased clarity: The template can help you identify the key factors that are driving or restraining your project, allowing you to focus on the most important areas.
Improved decision-making: By analyzing the various factors that impact your project, you can make more informed decisions about how to move forward.
Enhanced collaboration: The template allows you to work collaboratively with your team, fostering communication and collaboration.
Increased creativity: The force field analysis template helps you think outside the box and come up with innovative solutions to complex problems.
Better alignment: By identifying the key driving and restraining forces, you can ensure that your team is aligned around a common goal.
Do you need more advanced diagramming? Miro's extensive shape pack library, collaboration features, and technical diagramming capabilities provide robust solutions for teams.
Can I customize the template to fit my specific needs?
Absolutely! The template is fully customizable, allowing you to add or remove shapes and connector lines as needed.
How can I collaborate with my team on the template?
Miro allows for real-time collaboration, so you can work together with your team in real-time, no matter where you are.
Can I export the template to other platforms?
Yes, Miro allows you to export your templates to various formats, including PDF, PNG, and JPEG.
Get started with this template right now.
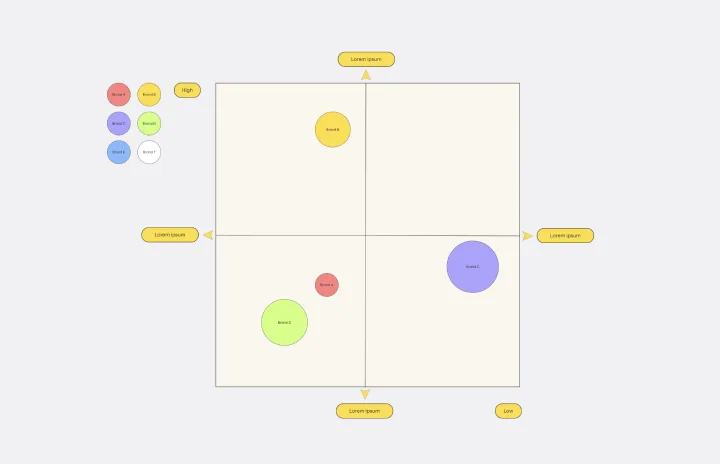
Strategic Group Mapping Template
Works best for:
Mapping, Strategy
The Strategic Group Mapping Template is a cutting-edge visual tool designed to translate the competitive landscape of their industry. By allowing users to plot entities based on distinct criteria, this template provides an at-a-glance view of market dynamics. One standout benefit of using this tool is its ability to identify clusters of competitors and market gaps, paving the way for businesses to strategically position themselves for optimal success.
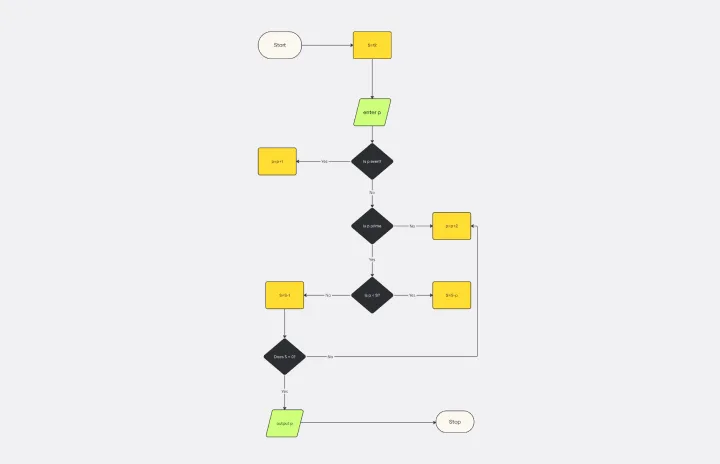
Algorithm Flowchart Template
Works best for:
Flowcharts
The Algorithm Flowchart Template is a useful tool for simplifying the process of creating and understanding complex algorithms. Its pre-structured format makes it easy to lay out each operation and decision point in a clear and easily understandable visual format. This is particularly helpful for explaining intricate processes to team members who may not be as technically proficient in the subject matter. With each step clearly defined within its designated shape, the flowchart promotes clarity and makes it easy to identify the logical flow at a glance. This clarity is the template's most significant advantage, reducing cognitive load and enabling a more inclusive and straightforward approach to discussing and refining algorithmic solutions.
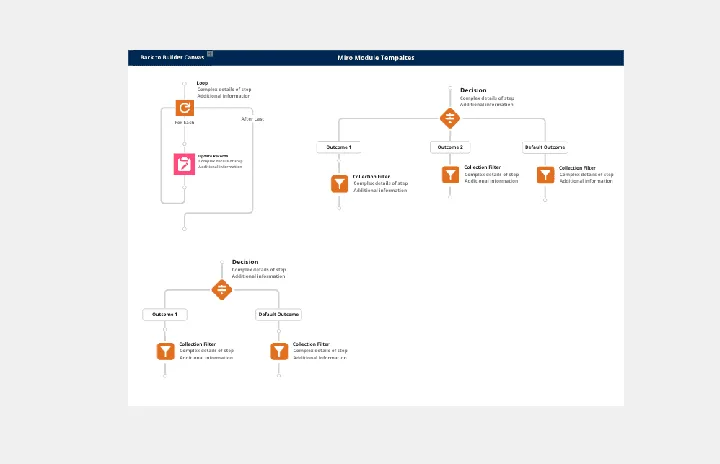
Salesforce Flow Builder
Works best for:
Flowcharts, Mapping, Diagrams
The Salesforce Flow Builder template offers a visual tool for designing and automating business processes within the Salesforce platform. It provides elements for creating flowcharts that represent process flows, decision logic, and data transformations. This template enables Salesforce administrators and developers to streamline workflows, improve productivity, and enhance user experiences. By promoting automation and efficiency in Salesforce process design, the Salesforce Flow Builder empowers organizations to leverage the full potential of the Salesforce platform and drive business success effectively.

Login Sequence Diagram Template
Works best for:
Diagramming, Technical Diagramming
The UML Sequence Login Diagram Template is a valuable tool for visualizing user authentication processes. It breaks down complex login sequences into clear, visual components, facilitating collaborative understanding among team members, regardless of their technical expertise. This shared understanding is crucial for ensuring all stakeholders, from developers to project managers, are on the same page, leading to efficient decision-making and a smoother development process. The template's ability to translate technical details into an accessible format streamlines communication and significantly reduces the likelihood of misinterpretation or oversight, making it an essential asset in any software development project.
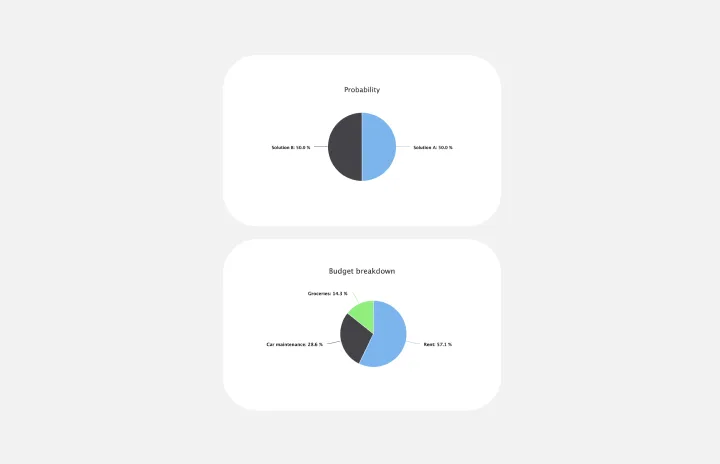
Pie Chart Template
Works best for:
Education, Operations
Pie charts are an excellent way to present relationships between datasets graphically, where you can quickly compare information and see contrast right away. Professionals from many fields use pie charts to support their presentations and enrich their storytelling as it’s one of the most commonly used data charts.
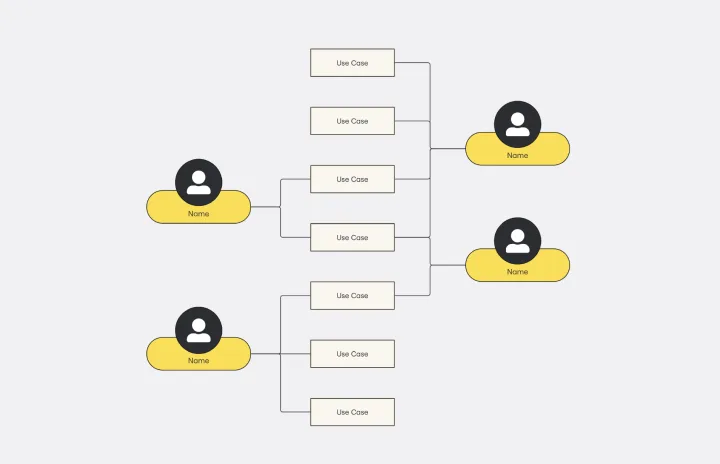
Use Case Diagram Template
Works best for:
Marketing, Market Research, Diagrams
A use case diagram is a visual tool that helps you analyze the relationships between personas and use cases. Use case diagrams typically depict the expected behavior of the system: what will happen and when. A use case diagram is helpful because it allows you to design a system from the perspective of the end user. It’s a valuable tool for communicating your desired system behavior in the language of the user, by specifying all externally visible system behavior.