Algorithm Flowchart Template
Simplify the process of creating complex algorithms with the algorithm flowchart template.
Trusted by 65M+ users and leading companies


About the Algorithm Flowchart Template
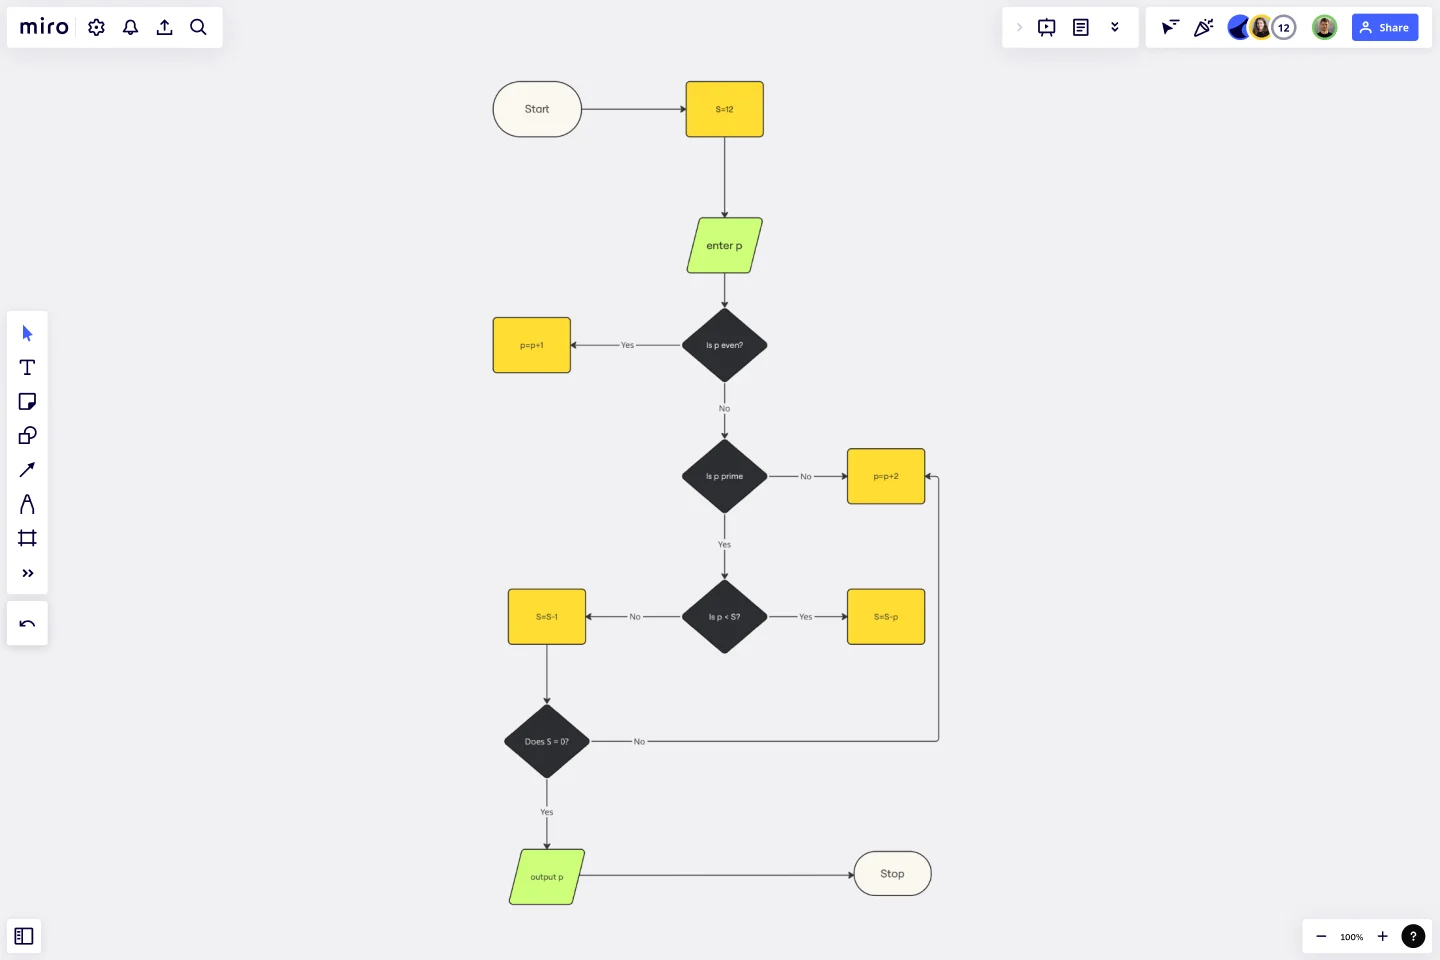
An algorithm flowchart is a graphical representation of a sequence of actions that make up an algorithm. It helps to streamline complex processes and make them easy to understand. Think of it as a blueprint that guides you through the logic of your algorithm, making it easier to go from problem to solution.
The algorithm flowchart template is a pre-designed framework that makes it easy to map out the process flow of an algorithm. It simplifies each step by breaking it down into individual components, represented by different shapes such as rectangles, diamonds, and ovals. Each shape represents a type of action or decision. By using clearly defined areas for input, operations, decisions, and outputs, users can methodically plot the course of their algorithm's logic. This tool is helpful for both beginners and experienced professionals.
How to use the algorithm flowchart template in Miro
Customize the flowchart: Double-click shapes to add your specific algorithm steps. The template is user-friendly, enabling you to edit text and shapes with just a few clicks.
Expand the diagram: Use automated diagramming features to drag and drop more shapes and connector lines, seamlessly expanding your flowchart.
Add context: Integrate any artifact on your board, such as notes, images, or links, to provide deeper insight into your algorithm.
The entire process is designed for efficiency and adaptability, ensuring your algorithm flowchart can grow and evolve as your project does.
Why use an algorithm flowchart template?
Clarity of complex processes: It transforms intricate algorithms into clear, visual steps, enhancing understanding for all stakeholders.
Efficiency in design: Saves time by providing a ready-made structure, which can be easily adjusted to fit various algorithms.
Collaboration: Fosters teamwork by allowing multiple contributors to view and edit the flowchart in real-time.
Reduce error: By laying out each step visually in a flowchart, potential issues can be identified and corrected early in the development process.
Documentation: The template acts as a dynamic document that can be referenced throughout the algorithm's lifecycle, from development to maintenance.
If you'd prefer to create an algorithm flowchart from scratch, Miro's flowchart tool is easy and intuitive to use.
Can the algorithm flowchart template handle complex algorithms with multiple conditions?
Absolutely. The template is designed to accommodate a variety of complexities, including algorithms with numerous conditions and branches.
Is it possible to export the flowchart for use in presentations or documents?
Yes, flowcharts created with the template can be exported and included in various document formats, making them suitable for presentations and reporting.
How does collaboration work with this template?
The template supports real-time collaboration. Multiple people can work on the flowchart simultaneously, making it perfect for team projects.
Are there any limits to how much I can customize the template?
There are no inherent limits. The template is fully customizable, allowing users to expand and change to meet their needs without restriction.
Get started with this template right now.
Fishbone Diagram by Hanna Havulinna
Works best for:
Diagramming
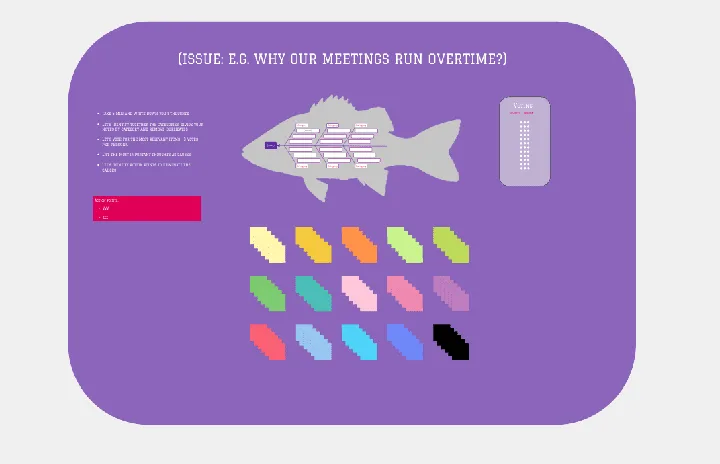
The Fishbone Diagram template, also known as the Ishikawa or Cause-and-Effect diagram, offers a visual tool for identifying and analyzing root causes of problems or issues. It provides a structured framework for categorizing potential causes into major categories such as people, process, environment, and equipment. This template enables teams to conduct root cause analysis systematically, facilitating problem-solving and decision-making. By promoting a structured approach to problem analysis, the Fishbone Diagram empowers teams to address issues effectively and implement corrective actions efficiently.
Intent to Outcome Diagram
Works best for:
Diagramming
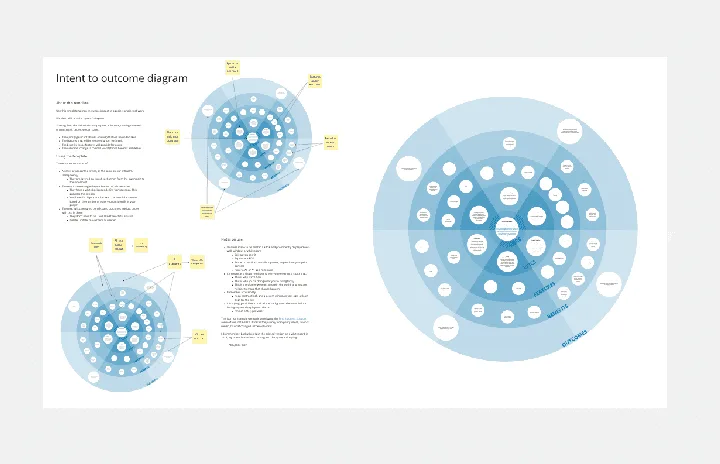
The Intent to Outcome Diagram template is a visual tool for mapping out the relationship between desired outcomes and the actions required to achieve them. It provides a structured framework for defining intentions, outcomes, and key activities. This template enables teams to align on goals, track progress, and identify areas for improvement. By promoting clarity and alignment, the Intent to Outcome Diagram empowers organizations to set strategic direction and drive results effectively.
Flowchart Template
Works best for:
Flowcharts, Mapping, Diagrams
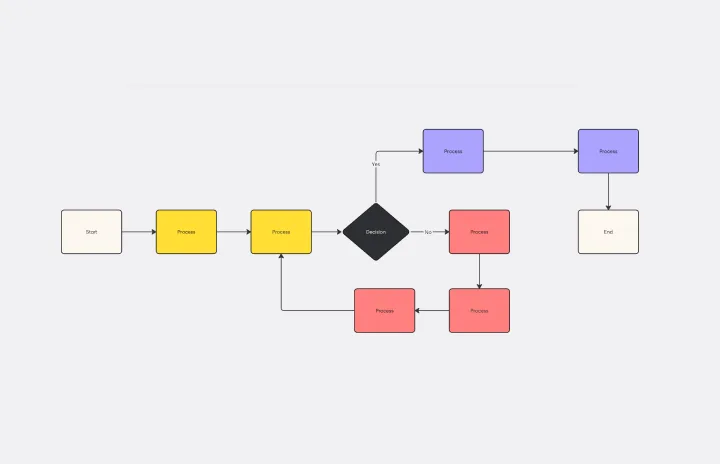
Trying to explain a process or workflow to your team — or just wrap your head around it yourself? Sometimes the best way is to see it, and that’s when you create a flowchart. Using common shapes (generally just ovals, rectangles, diamonds, and arrows), a flowchart shows you the direction a process or workflow goes and the order of steps. Beyond giving you a clear understanding, you’ll also be able to see potential flaws and bottlenecks, which helps you refine and improve your process and create a better product more efficiently.
OutSystems Architecture Diagram
Works best for:
Diagramming
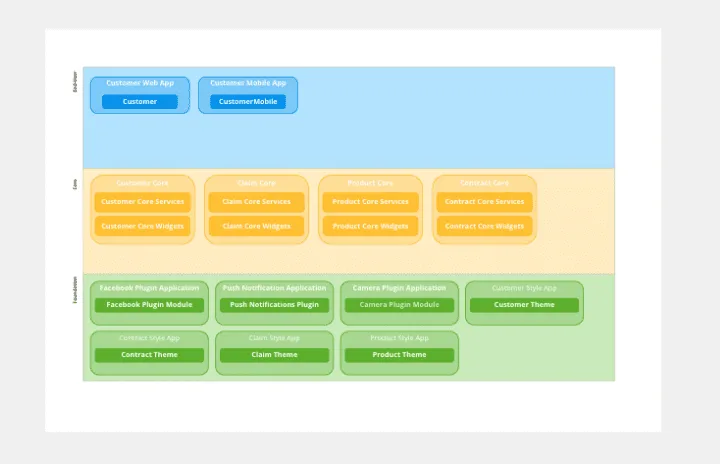
The OutSystems Architecture Diagram template offers a visual tool for designing and documenting software architectures using the OutSystems platform. It provides elements for modeling application components, data structures, and integration points. This template enables teams to visualize and communicate the architecture of their OutSystems applications, facilitating collaboration and alignment among developers and stakeholders. By promoting clarity and understanding of system architecture, the OutSystems Architecture Diagram empowers teams to build scalable, maintainable, and high-performance applications effectively.
Euler Diagram Template
Works best for:
Business Management, Operations, Diagrams
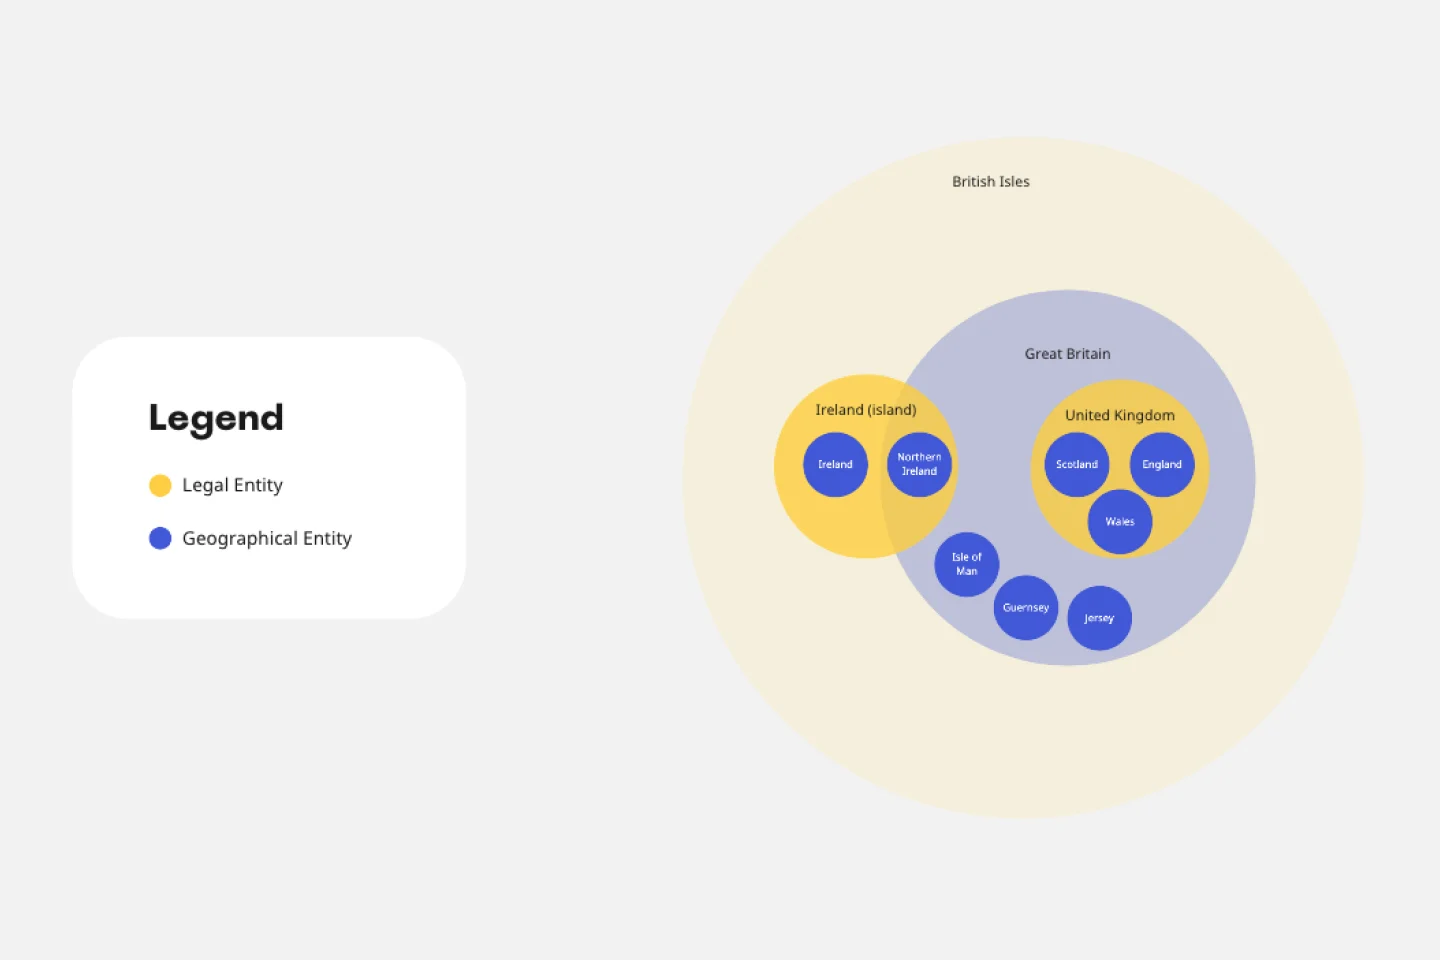
Euler diagrams are valuable for showing different relationships between subjects by representing them with circles or "cells." Euler diagrams are frequently used in IT systems to show how objects relate to one another and how they interact. However, you can use them for any sort of explanation that needs to show connections.
Vertical Organizational Chart
Works best for:
Organizational Charts, Organizational Design
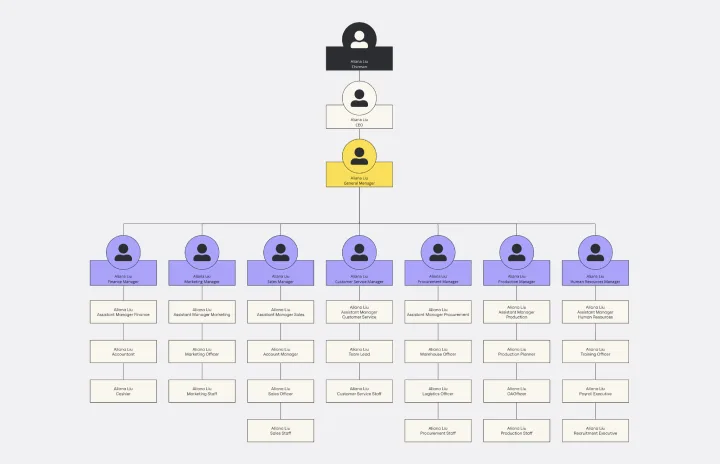
The Vertical Organizational Chart Template is an efficient way to illustrate the hierarchy of an entity in a top-down format. This tool helps represent roles and relationships in a clear manner, starting from the topmost authority and branching downwards. It allows for a better understanding of the flow of responsibilities and communication channels within the organization. One of its most significant advantages is promoting clear communication. Depicting the organization's structure helps avoid misunderstandings and ensures everyone is on the same page regarding the chain of command.