Strategic Group Mapping Template
Easily define your competitive landscape using the Strategic Group Mapping Template. From understanding your product position to analyzing competitors, this template empowers anyone to visualize market competition seamlessly.
Trusted by 65M+ users and leading companies


About the Strategic Group Mapping Template
We know that in the complex landscape of business strategy, it's crucial to have tools that can simplify our processes and offer clarity. Enter Miro's Strategic Group Mapping Template - designed to help you visually represent the competitive positions of different companies or products in your market.
What's a Strategic Group Mapping Template?
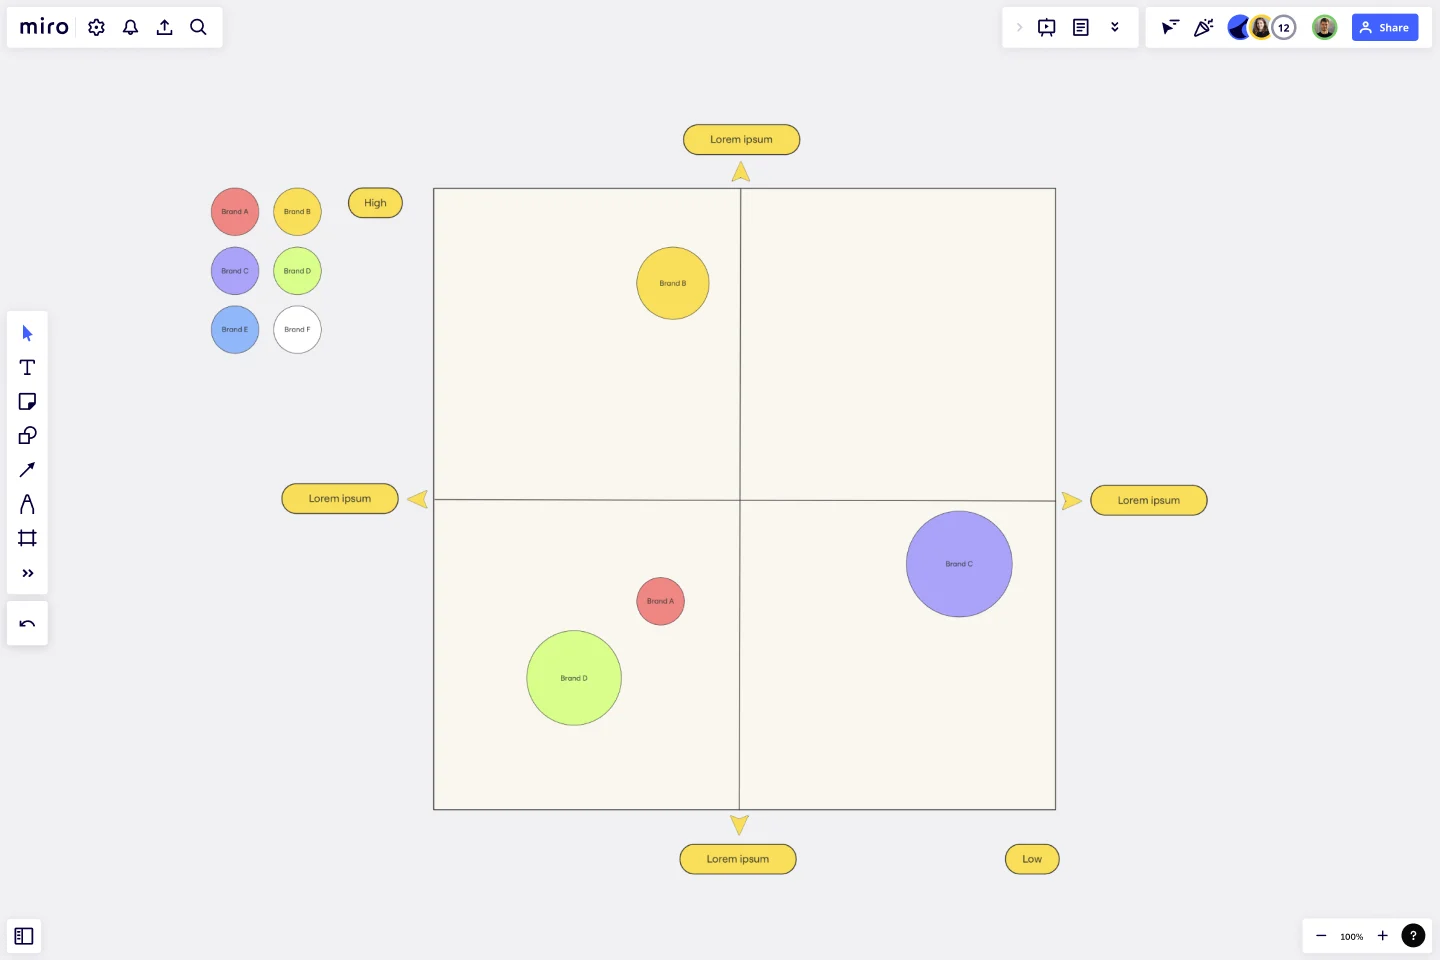
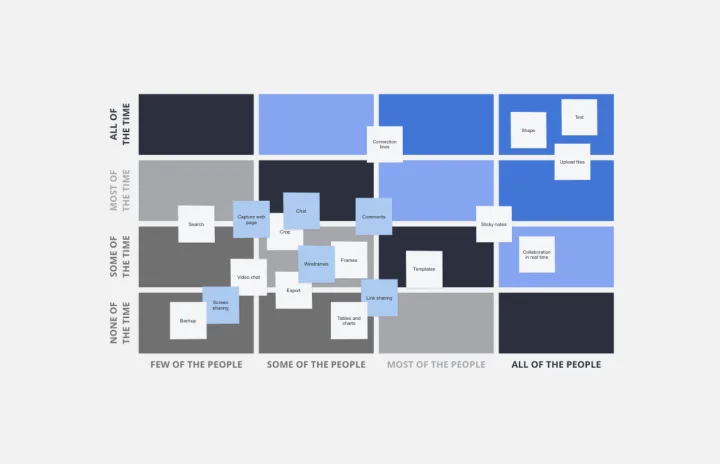
A Strategic Group Mapping Template is a visual tool that helps you plot out the competitive position of various entities within a market based on specific criteria. You can gain insights into market positions, potential market spaces, and competition intensity by placing competitors into different strategic groups based on key dimensions such as price range or product quality.
What are the benefits of using a Strategic Group Mapping Template?
Visual representation: By mapping competitors on a visual workspace, businesses can quickly identify clusters of similar competitors and gaps in the market.
Informed decision-making: It provides a clearer picture of where your business stands, aiding in more strategic decisions regarding market entry or product development.
Facilitates collaboration: As a shared template, teams can collaborate in real time, brainstorming and drawing insights together.
Enhances competitive analysis: Enables companies to identify potential threats or opportunities by visualizing where competitors are clustered and where market spaces are less dense.
How to use a Strategic Group Mapping Template in Miro?
Miro is flexible and interactive, making it a perfect place for strategic mapping. Here's how you can create one:
Open a new board: Select the Strategic Group Mapping Template in the Templates Library.
Use shapes: Edit the shapes on the template, or add more from Miro's shapes library. For your X and Y axis criteria, you can use lines and label them appropriately. Drag circles, rectangles, or other shapes to represent different companies or products.
Customize and position: Adjust the size, colors, and positions of shapes based on the relative position of competitors. The drag-and-drop feature ensures ease of positioning.
Collaborate: Invite team members to join your board and input their insights, ensuring a comprehensive mapping.
What criteria should I use for the axes on the map?
It varies by industry and what you're analyzing. Common criteria include price, quality, market share, product range, and geographical coverage.
How often should I update my strategic group map?
It's essential to update your map periodically, especially when there are significant market changes, new entrants, or shifts in competitor strategies.
Can multiple team members edit the map simultaneously?
Yes, Miro allows real-time collaboration, so multiple members can edit, comment, and brainstorm together on the same map.
Get started with this template right now.
Status Report Template
Works best for:
Project Management, Documentation, Strategic Planning
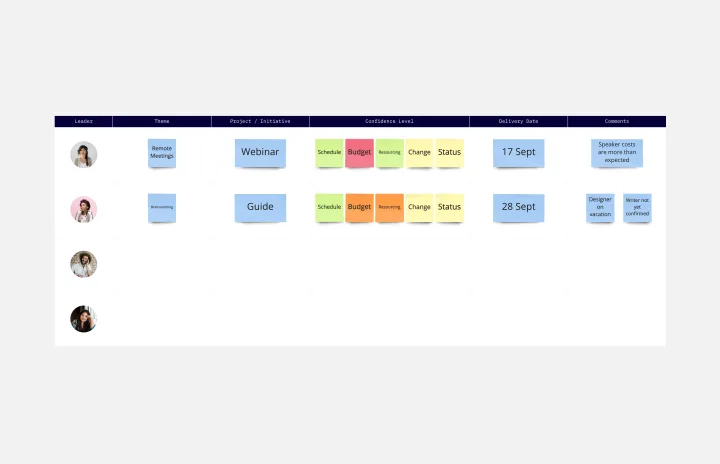
A status report provides a snapshot of how something is going at a given time. You can provide a status report for a project, a team, or a situation, as long as it emphasizes and maps out a project’s chain of events. If you’re a project manager, you can use this report to keep historical records of project timelines. Ideally, any project stakeholder should be able to look at a status report and answer the question, “Where are we, and how did we get here?” Use this template as a starting point to summarize how something is progressing against a projected plan or outcome.
Empathy Map Template
Works best for:
Market Research, User Experience, Mapping
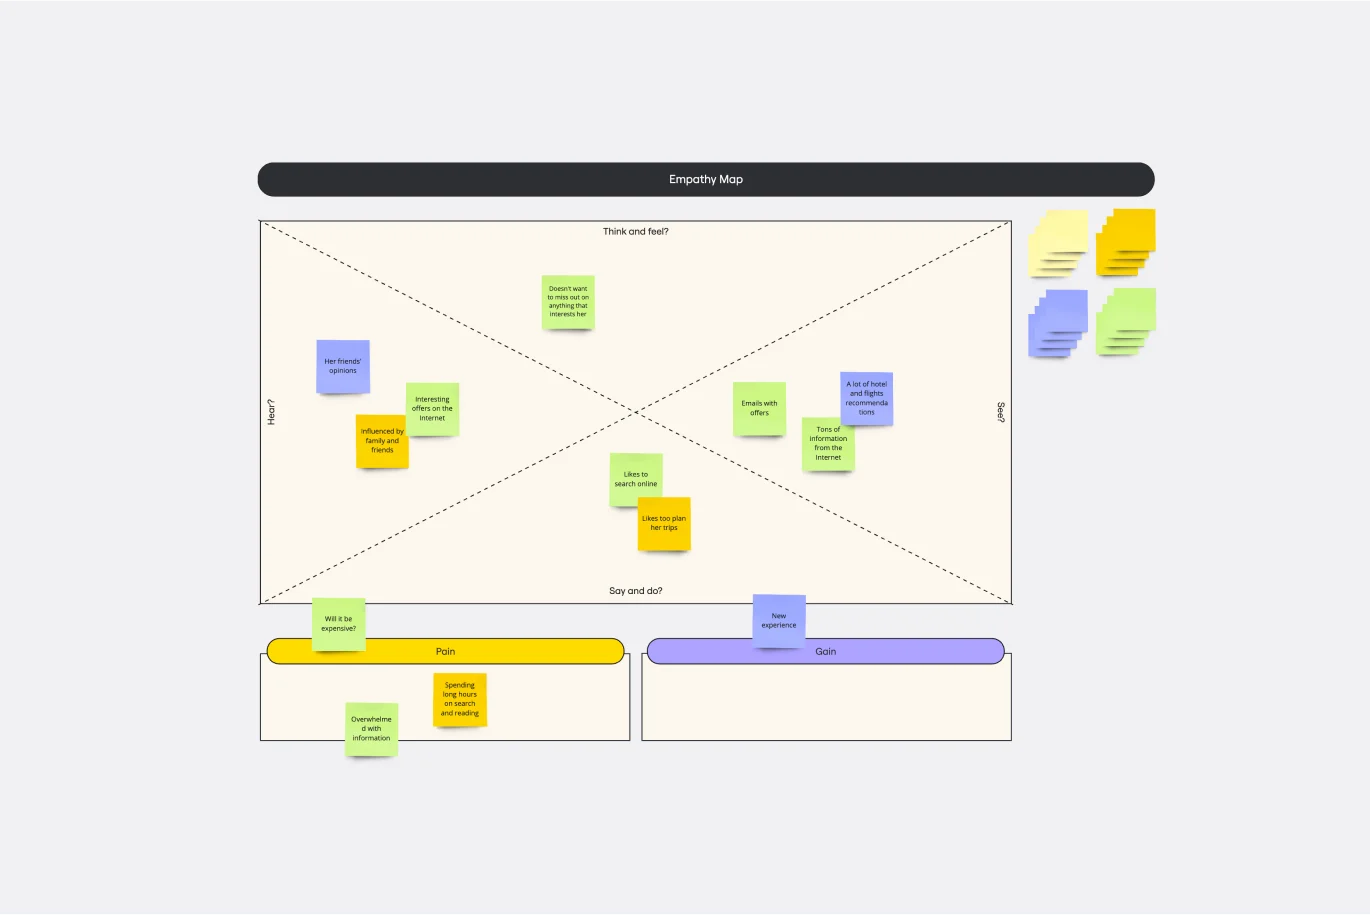
Attracting new users, compelling them to try your product, and turning them into loyal customers—it all starts with understanding them. An empathy map is a tool that leads to that understanding, by giving you space to articulate everything you know about your customers, including their needs, expectations, and decision-making drivers. That way you’ll be able to challenge your assumptions and identify the gaps in your knowledge. Our template lets you easily create an empathy map divided into four key squares—what your customers Say, Think, Do, and Feel.
Inverted Org Chart Template
Works best for:
Diagramming, Org Charts, Organizational Design
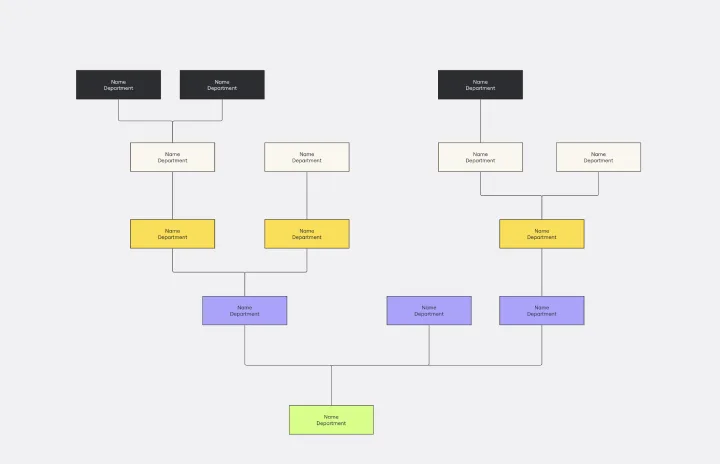
The Inverted Org Chart Template is a tool that reimagines the traditional hierarchical model by placing frontline employees at the top of the organizational structure. This innovative approach highlights the crucial role played by those who interact with customers directly, ensuring that their insights and contributions are not only recognized but also celebrated. One of the key advantages of this template is that it fosters a feedback-driven environment. Prioritizing frontline workers promotes a culture where valuable insights from the ground can quickly reach the top of the hierarchy, streamlining decision-making processes and ensuring that strategies are based on real-world experiences.
CI/CD Pipeline Diagram Template
Works best for:
Diagramming, Development
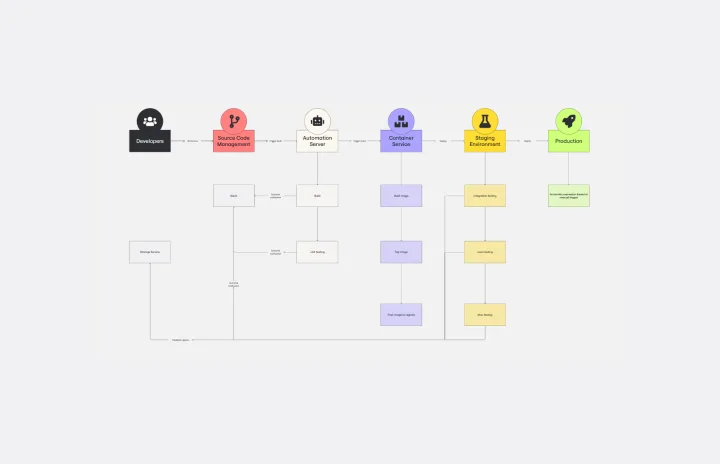
The CI/CD template is a well-designed roadmap for software deployment that enables a smooth and automated flow from development to production. This strategic layout includes critical elements such as source code management, automation servers, container orchestration, staging environments, and the final deployment to production. One of the key benefits of using such a template is that it builds a robust deployment pipeline, which significantly reduces manual intervention and human error. By visualizing each step and integrating automation throughout, teams can achieve faster deployment cycles, ensuring that new features, updates, and fixes are delivered to users promptly and reliably. This enhanced pace does not compromise quality, as the template inherently supports continuous testing and quality assurance, ensuring that each update is quick but also secure and stable before it is delivered to the end user.
Features Audit Template
Works best for:
Desk Research, Product Management, User Experience
Add new features or improve existing features—those are the two paths toward improving a product. But which should you take? A features audit will help you decide. This easy, powerful product management tool will give you a way to examine all of your features, then gather research and have detailed discussions about the ones that simply aren’t working. Then you can decide if you should increase those features’ visibility or the frequency with which it’s used—or if you should remove it altogether.
Stakeholder Mapping Template
Works best for:
Business Management, Mapping, Workflows
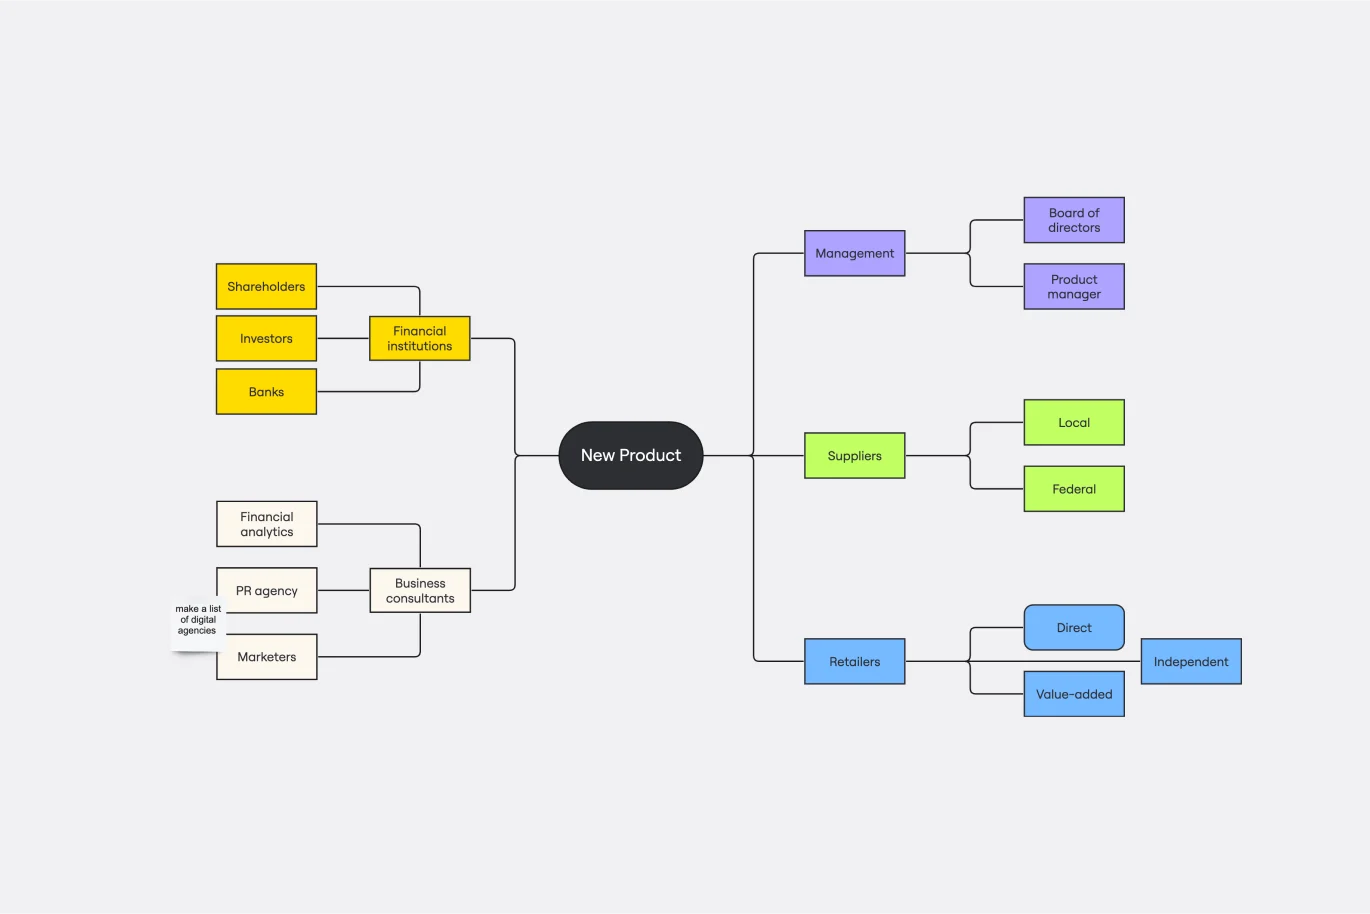
A stakeholder map is a type of analysis that allows you to group people by their power and interest. Use this template to organize all of the people who have an interest in your product, project, or idea in a single visual space. This allows you to easily see who can influence your project, and how each person is related to the other. Widely used in project management, stakeholder mapping is typically performed at the beginning of a project. Doing stakeholder mapping early on will help prevent miscommunication, ensure all groups are aligned on the objectives and set expectations about outcomes and results.