Precedence Diagram
Optimize resource allocation with the Precedence Diagram Template. By discerning which tasks can run concurrently and which need to wait for others to complete, teams can manage their resources more effectively, ensuring smoother, more efficient project progression.
Trusted by 65M+ users and leading companies


About the Precedence Diagram Template
The Precedence Diagram Template is a powerful resource to help teams visualize their project workflows with clarity and precision. By enabling a clear representation of project management processes, the template fosters enhanced productivity and streamlines tasks, ensuring teams can navigate their projects with confidence and efficiency.
What is a Precedence Diagram?
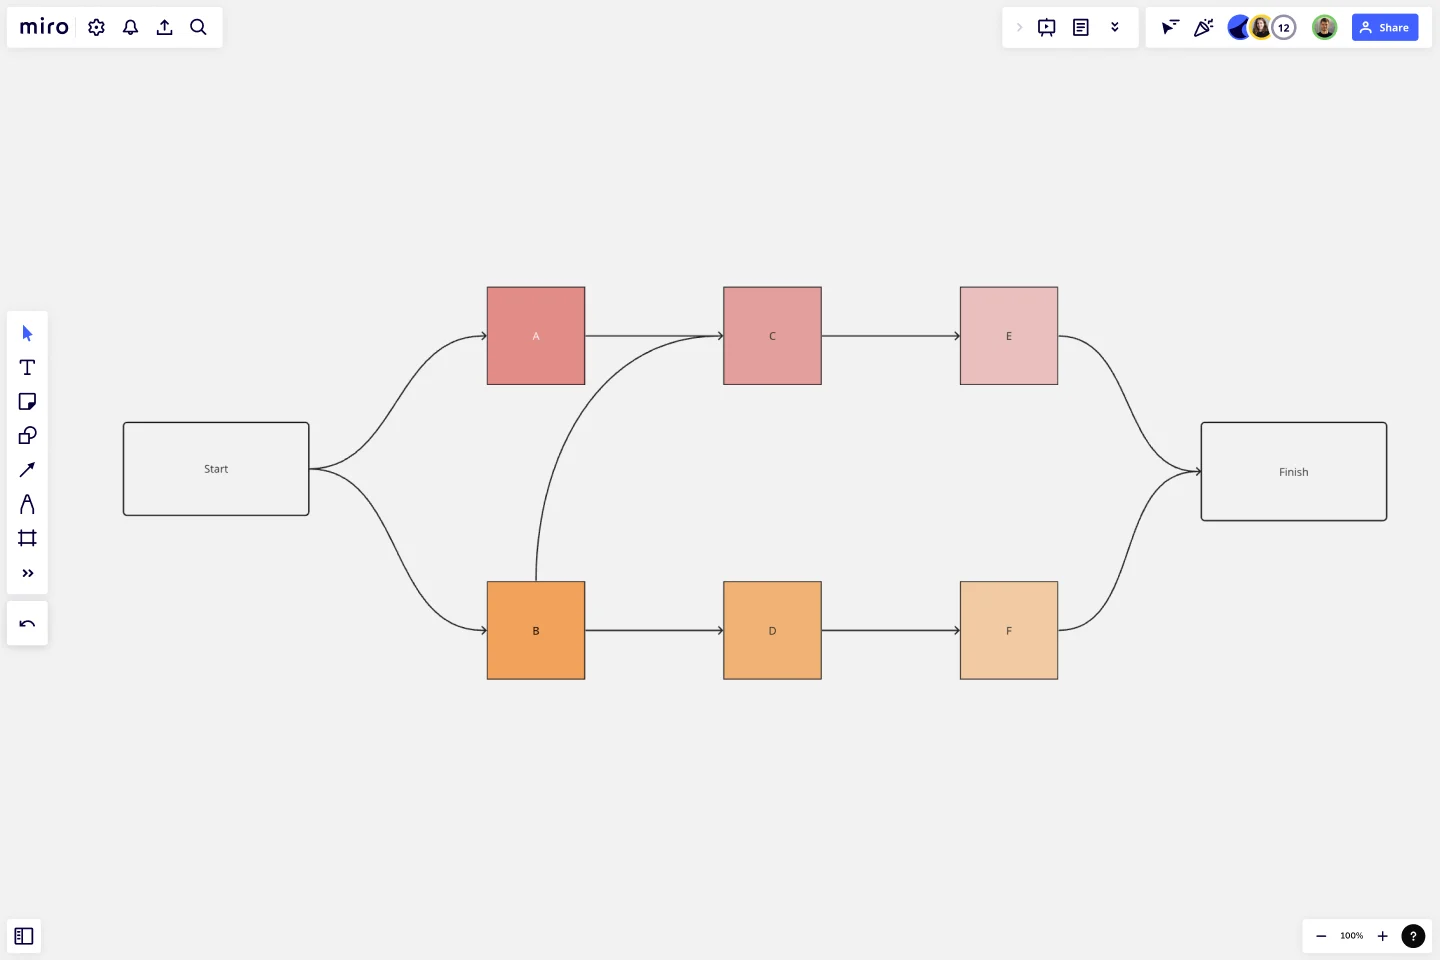
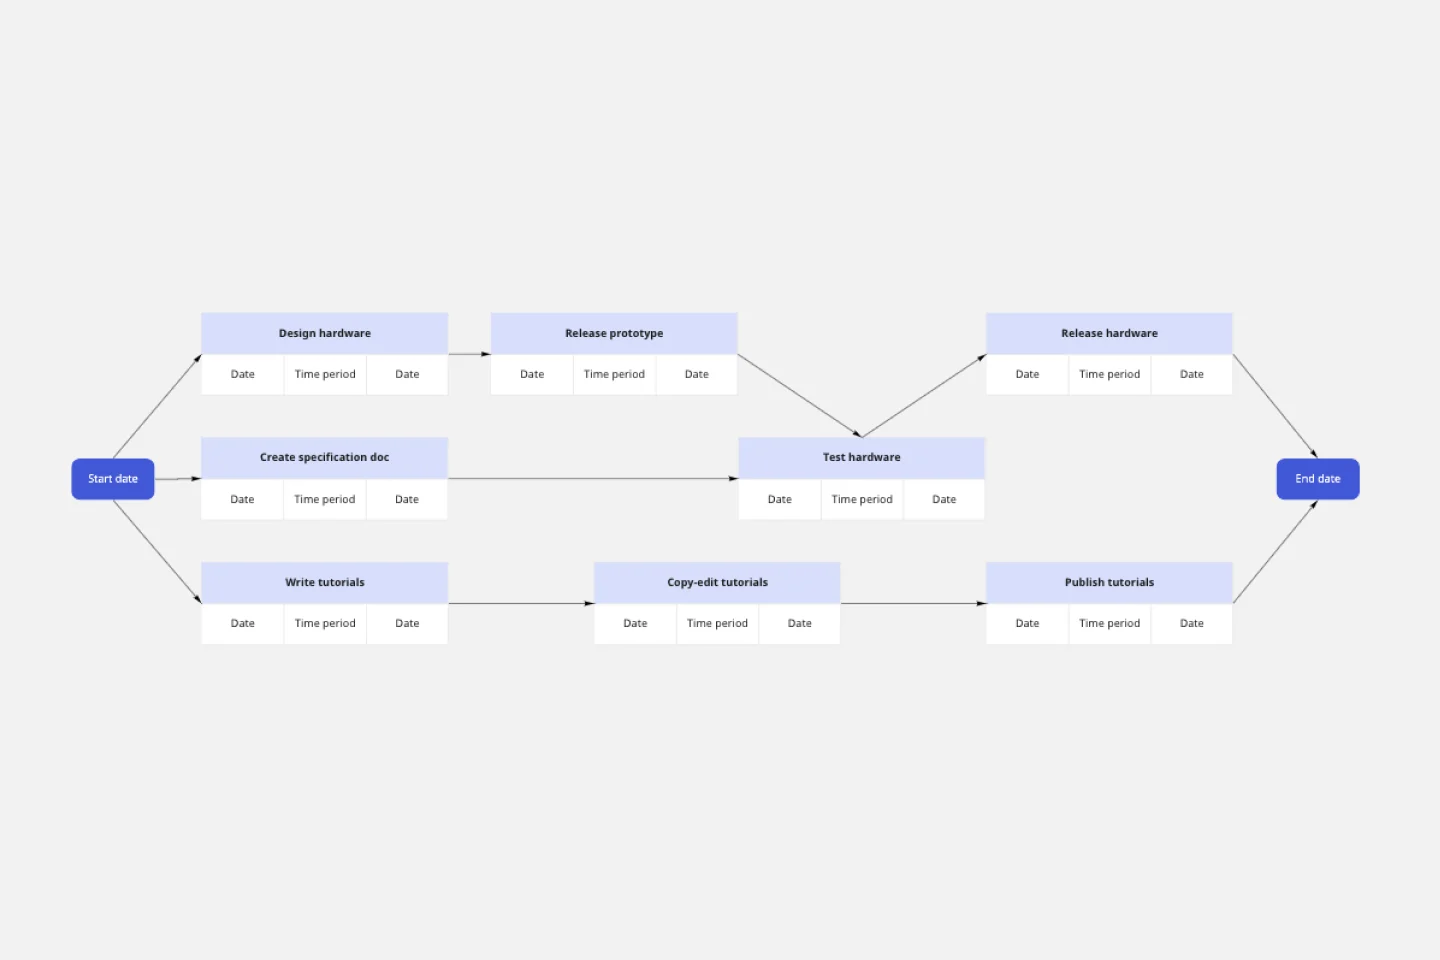
A precedence diagram, often called a Project Network Diagram, is a graphical tool that shows project activities and their interdependencies. By visualizing these connections, teams can gain clarity on the order in which tasks must be performed and identify which tasks can occur concurrently. The template is designed to simplify the creation of these valuable visualizations.
One significant benefit of using the Precedence Diagram Template is its ability to enhance project efficiency. By clearly outlining task sequences and potential overlaps, project managers can allocate resources more effectively and avoid bottlenecks, ensuring that the project remains on track and meets its deadlines. This foresight can save time and lead to substantial cost savings, making the precedence diagram an indispensable tool for any project-driven team.
How to use a Precedence Diagram Template in Miro
Miro's interactive board features, coupled with its automated diagramming capabilities, make creating precedence diagrams a breeze. Here's how you can set up a Precedence Diagram Template on your Miro board in four simple steps:
Select the Precedence Diagram Template: In the Template Library, search for "precedence diagram" and select the template from the results.
Customize your diagram: Use Miro's automated diagramming features to draw connections between tasks, indicating their relationships. Simply drag and drop items to reposition them or connect them with arrows to show the flow of tasks.
Collaborate and share: Invite your team members to collaborate in real time. Miro enables you to discuss, edit, and refine the diagram, ensuring everyone's on the same page.
Can I customize the look and feel of the precedence diagram?
Yes, Miro's interface is highly intuitive, allowing you to change colors, shapes, and fonts to match your team or project's branding.
Is there a limit to how many tasks I can add to my diagram?
There's no strict limit. However, for readability and usability, we recommend ensuring that your diagram remains clear and uncluttered by periodically reviewing and refining it.
Can I link other Miro boards or external resources to tasks in the precedence diagram?
Yes, you can! Simply use the linking tool in Miro to connect tasks to relevant boards or external resources, providing more context and information.
How do I ensure that only authorized team members can edit the diagram?
Miro allows you to set permissions for each individual or group. You can grant view-only, commenting, or editing access based on what's suitable for your team's needs.
Get started with this template right now.
Turtle Diagram for BA
Works best for:
Diagramming
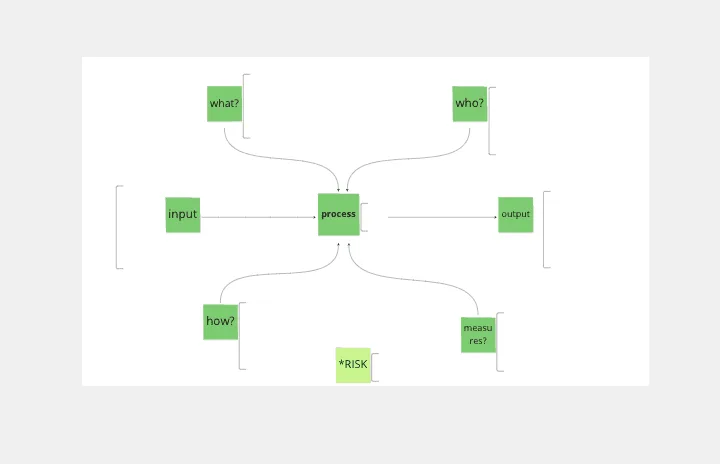
The Turtle Diagram for BA template offers a visual framework for defining and auditing business processes according to ISO 9001 standards. It provides elements for documenting process inputs, outputs, activities, and controls. This template enables organizations to ensure compliance, identify process improvements, and enhance quality management practices. By promoting systematic process documentation and auditability, the Turtle Diagram for BA empowers organizations to achieve and maintain ISO 9001 certification, demonstrating commitment to quality and continuous improvement.

20/80 Process Diagram - EOS Compatible
Works best for:
Diagramming
The 20/80 Process Diagram - EOS® Compatible template is a visual tool for mapping out processes and workflows aligned with the Entrepreneurial Operating System (EOS®) methodology. It provides a structured framework for identifying core processes and key activities that drive business outcomes. This template enables organizations to streamline operations, clarify roles and responsibilities, and enhance accountability. By promoting alignment with EOS® principles, the 20/80 Process Diagram empowers teams to achieve organizational excellence and drive sustainable growth.
Dichotomous Key Template
Works best for:
Diagramming
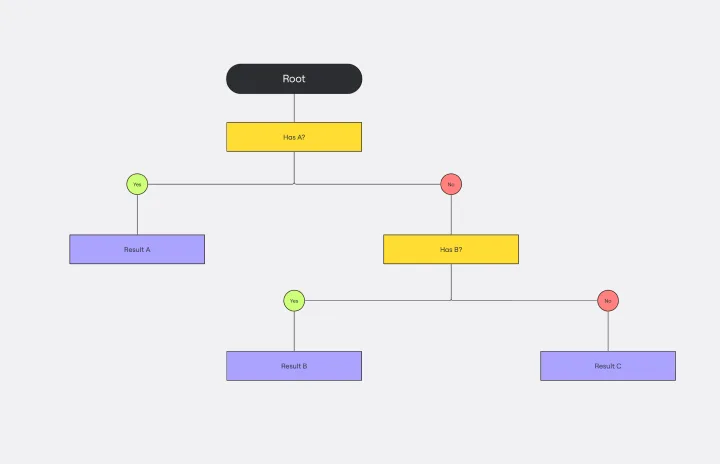
The Dichotomous Key Template stands out as an exceptional tool for simplifying complex classification processes, significantly enhancing learning experiences. Breaking down intricate subjects into a series of binary decisions transforms how information is absorbed and understood. This systematic approach not only aids in retaining intricate details but also makes the learning process more engaging and interactive. Whether for educational purposes or professional use, the template’s design fosters a deeper comprehension of the subject matter, allowing learners and professionals to navigate complex scenarios with clarity and ease.
Algorithm Flowchart Template
Works best for:
Flowcharts
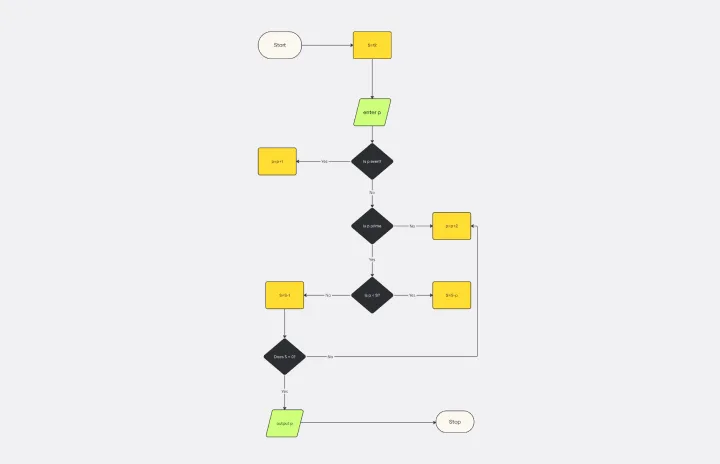
The Algorithm Flowchart Template is a useful tool for simplifying the process of creating and understanding complex algorithms. Its pre-structured format makes it easy to lay out each operation and decision point in a clear and easily understandable visual format. This is particularly helpful for explaining intricate processes to team members who may not be as technically proficient in the subject matter. With each step clearly defined within its designated shape, the flowchart promotes clarity and makes it easy to identify the logical flow at a glance. This clarity is the template's most significant advantage, reducing cognitive load and enabling a more inclusive and straightforward approach to discussing and refining algorithmic solutions.

Azure Architecture Diagram Template
Works best for:
Software Development, Diagrams
The Azure Architecture Diagram Template is a diagram that will help you visualize the combination of any data and build and deploy custom machine learning models at scale. Azure is Microsoft’s cloud computing platform, designed to provide cloud-based services such as remote storage, database hosting, and centralized account management. Use Azure Architecture Diagram template to build sophisticated, transformational apps.
PERT Chart Template
Works best for:
Mapping, Project Planning
A Program Evaluation and Review Technique (PERT) diagram is used to plan projects efficiently. They help you set a clear timeline, plan out tasks and dependencies, and determine a critical path.