Double Bubble Map Template
Unlock the potential of visual thinking and enhance your team's collaboration with Miro's double bubble map template. Explore the endless possibilities for brainstorming, problem-solving, and ideation.
Trusted by 65M+ users and leading companies


About the Double Bubble Map Template
Brainstorm, analyze, and compare ideas or concepts in a structured and engaging way with Miro's double bubble map template. Whether planning a project, facilitating a discussion, or organizing your thoughts, this template enables creativity and clarity within your team.
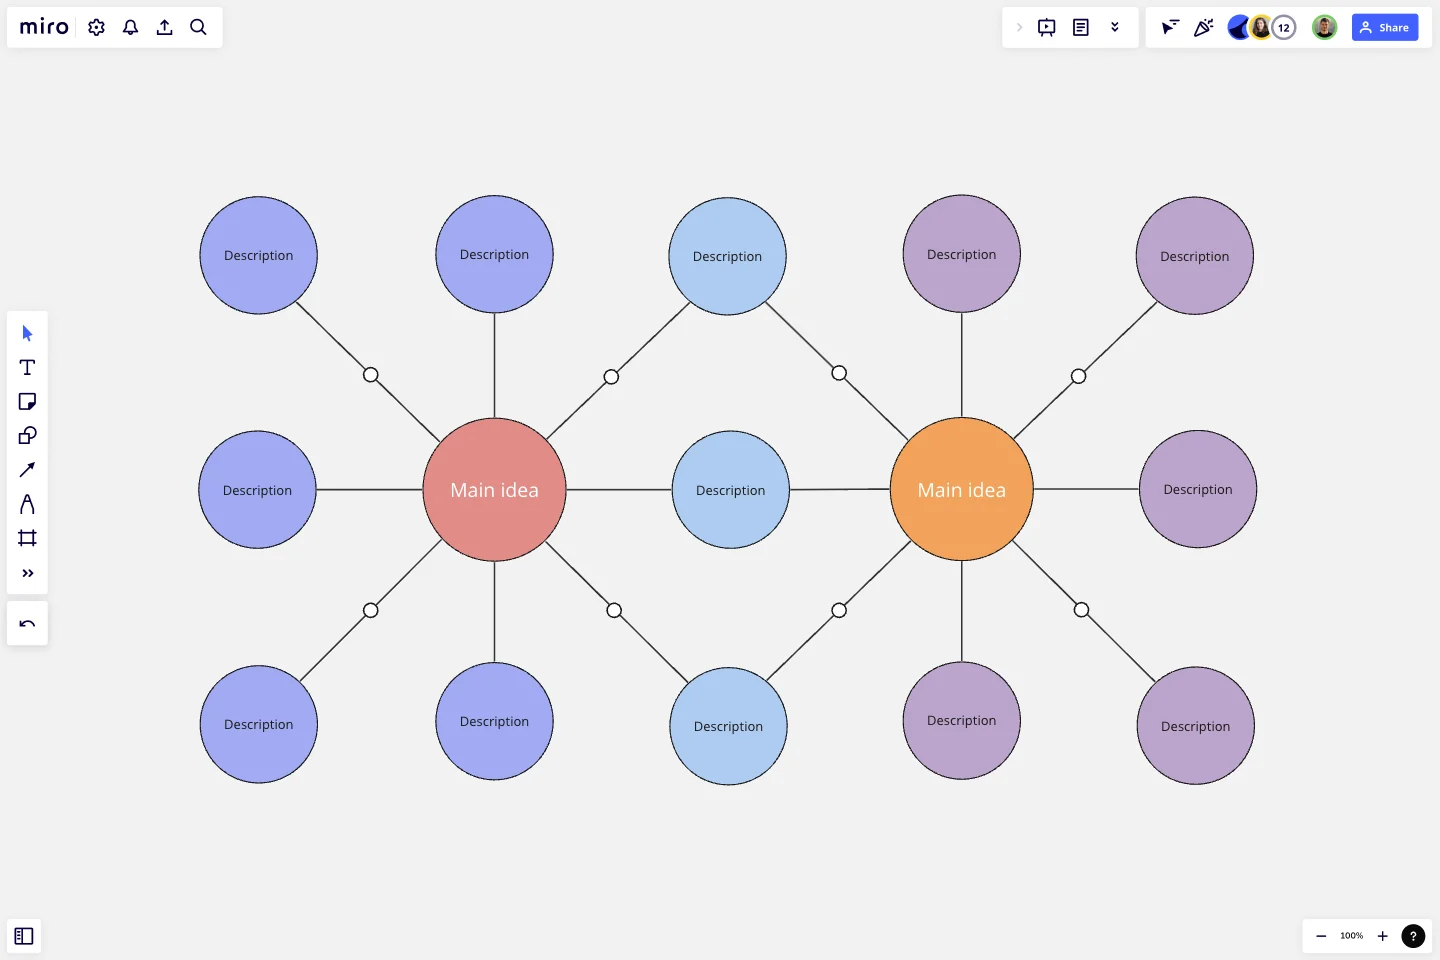
What's a double bubble map template?
A double bubble map template is a visual diagramming tool that allows teams to explore relationships and connections between central ideas or concepts. It consists of two interconnected bubbles, each representing one of the main ideas. Lines and connecting elements extend from these bubbles to show the ideas' relationships, similarities, and differences. This template is a dynamic framework for brainstorming, organizing information, and gaining insights into complex topics by visualizing how ideas interrelate.
Benefits of using the double bubble map template
Enhanced clarity: The double bubble map helps teams clarify their thoughts and ideas by visually representing the connections between two central concepts. This clarity minimizes misunderstandings and ensures everyone is on the same page.
Efficient brainstorming: It fosters efficient brainstorming sessions, encouraging teams to explore the intersections of ideas and identify potential areas of synergy or conflict.
Improved decision-making: Teams can make more informed decisions by using the template to weigh the pros and cons of different options, making it a valuable tool for problem-solving.
Effective communication: Visualizing complex relationships makes communicating ideas within the team and with stakeholders easier, promoting effective collaboration.
Customization: Miro's double bubble map template is highly customizable, allowing teams to adapt it to their specific needs and preferences.
How to use the double bubble map template in Miro
Creating a double bubble map diagram in Miro is a breeze:
Add the template: Search the Miro Template Library for the "Double Bubble Map Template." Click to add it to your board.
Customize your map: Double-click on the bubbles to add your central ideas. Use Miro's drawing tools and connectors to visualize the relationships and details.
Collaborate with others: Share the board link with your team members and collaborate in real time, whether in the same room or working remotely. Discuss, share, and refine your ideas quickly with Miro's bubble map maker.
Can I add more than two central ideas to the double bubble map template?
The double bubble map template in Miro is primarily designed for comparing two main ideas. However, you can create multiple templates within a board to effectively compare more than two concepts.
Can I export or print my double bubble map for offline use?
Yes, you can export your double bubble map as an image or PDF from Miro, making it easy to share or print for offline reference.
Are there collaboration restrictions on the double bubble map template in Miro?
No, Miro allows real-time collaboration for all users on a board, so your team can work together seamlessly on your double bubble map.
Get started with this template right now.
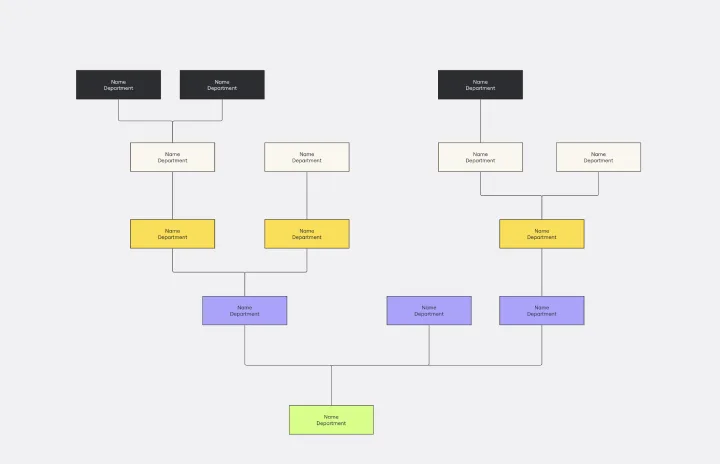
Vertical Organizational Chart
Works best for:
Organizational Charts, Organizational Design
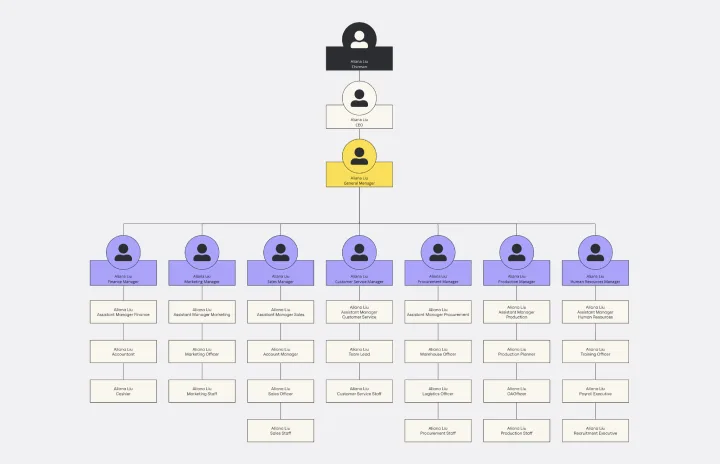
The Vertical Organizational Chart Template is an efficient way to illustrate the hierarchy of an entity in a top-down format. This tool helps represent roles and relationships in a clear manner, starting from the topmost authority and branching downwards. It allows for a better understanding of the flow of responsibilities and communication channels within the organization. One of its most significant advantages is promoting clear communication. Depicting the organization's structure helps avoid misunderstandings and ensures everyone is on the same page regarding the chain of command.
Supply and Demand Graph Template
Works best for:
Market Research, Mapping, Diagrams
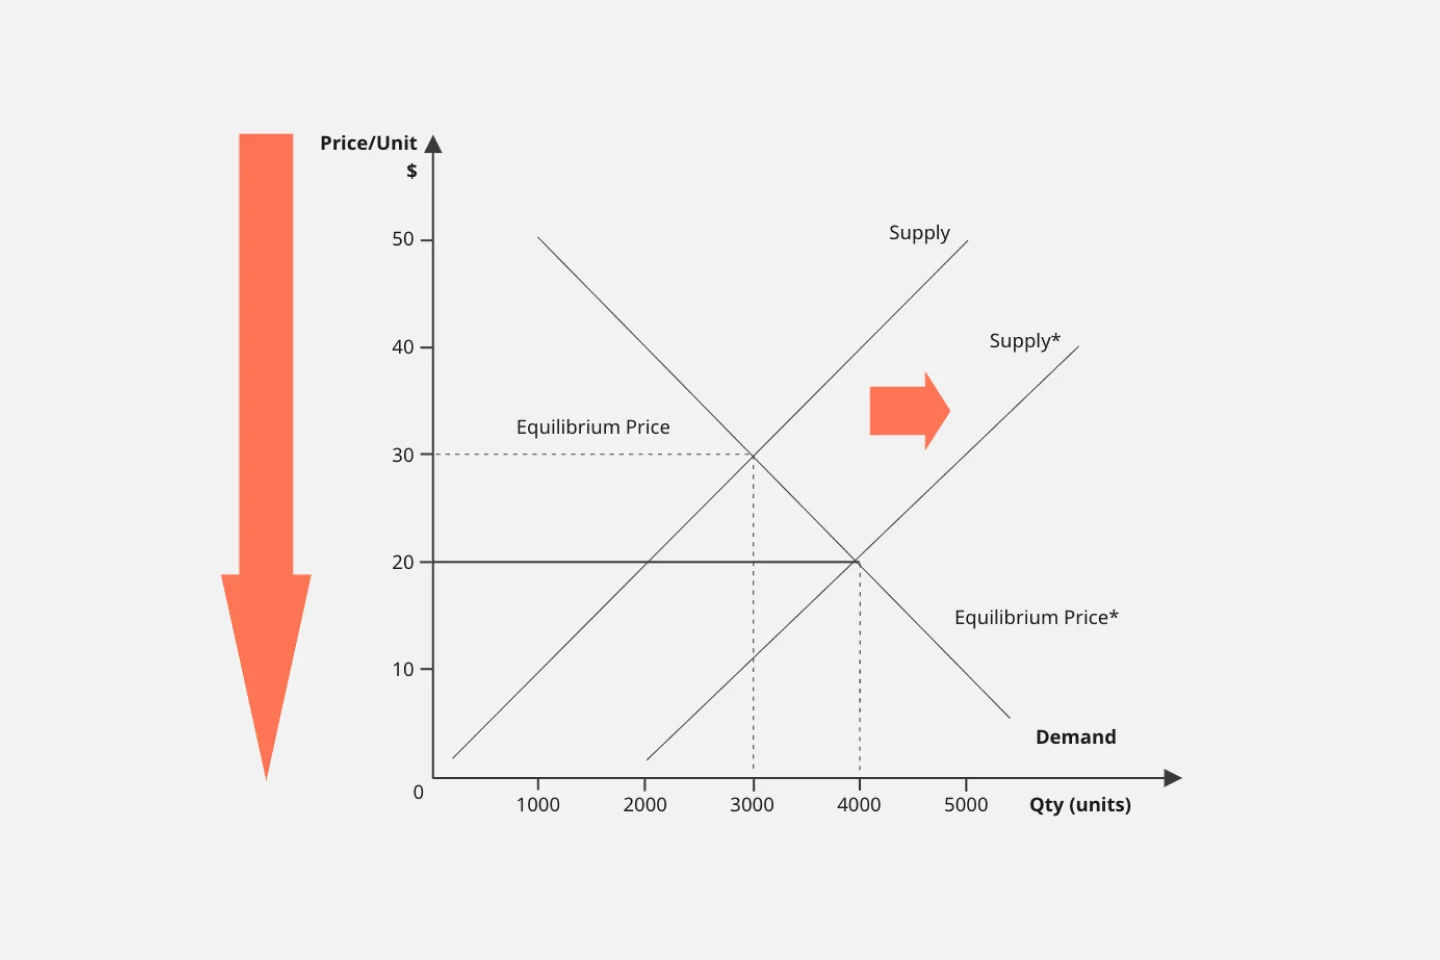
How do you price your product so that you make a profit while keeping customers and manufacturers happy? By finding a fair price. A supply and demand diagram is a graph that visualizes how much demand there is for your product and how many products you need. This, in turn, helps you with product pricing.
Block Diagram Template
Works best for:
Mapping, Software Development, Diagrams
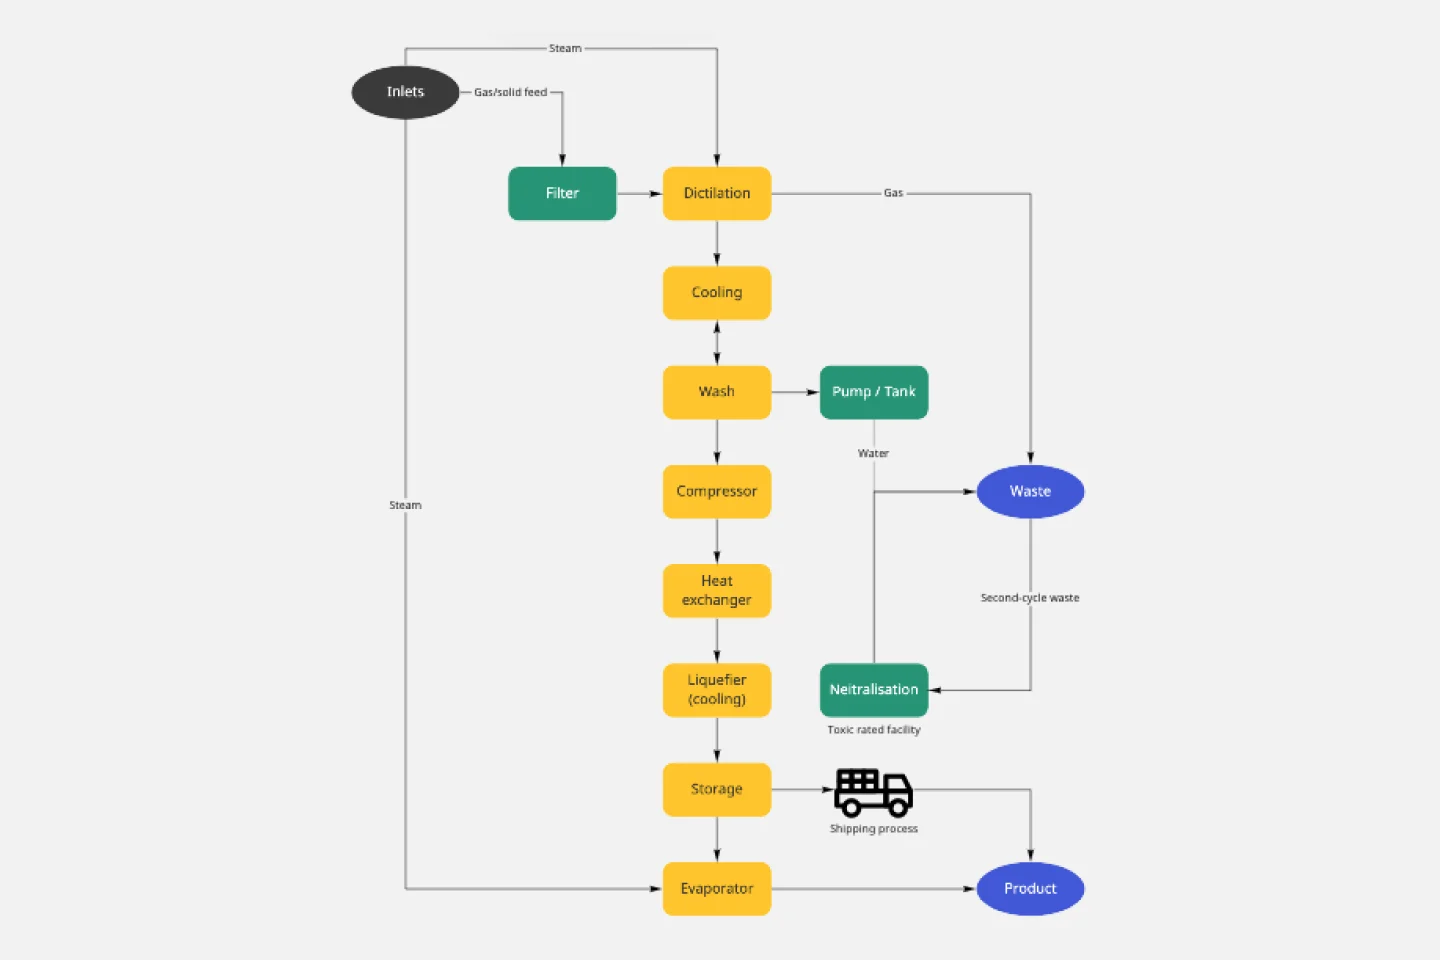
Use this template to illustrate technical systems. Blocks represent important objects in the system, and arrows demonstrate how the objects relate to each other. Perfect for engineers, workflow managers, or anyone trying to build a better process.
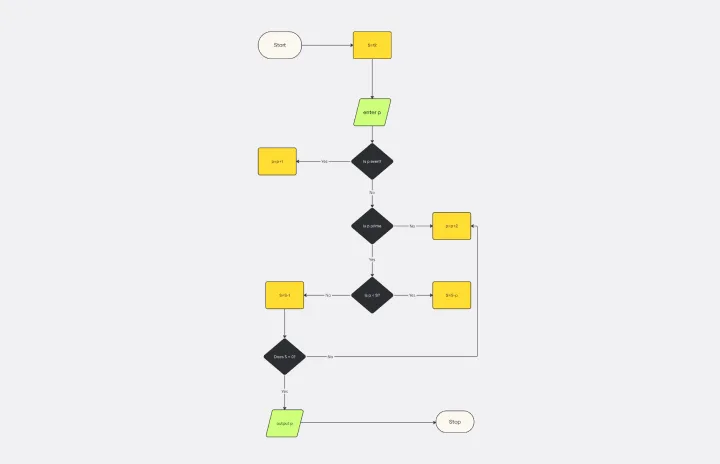
Algorithm Flowchart Template
Works best for:
Flowcharts
The Algorithm Flowchart Template is a useful tool for simplifying the process of creating and understanding complex algorithms. Its pre-structured format makes it easy to lay out each operation and decision point in a clear and easily understandable visual format. This is particularly helpful for explaining intricate processes to team members who may not be as technically proficient in the subject matter. With each step clearly defined within its designated shape, the flowchart promotes clarity and makes it easy to identify the logical flow at a glance. This clarity is the template's most significant advantage, reducing cognitive load and enabling a more inclusive and straightforward approach to discussing and refining algorithmic solutions.
Inverted Org Chart Template
Works best for:
Org Charts, Organizational Design
The Inverted Org Chart Template is a tool that reimagines the traditional hierarchical model by placing frontline employees at the top of the organizational structure. This innovative approach highlights the crucial role played by those who interact with customers directly, ensuring that their insights and contributions are not only recognized but also celebrated. One of the key advantages of this template is that it fosters a feedback-driven environment. Prioritizing frontline workers promotes a culture where valuable insights from the ground can quickly reach the top of the hierarchy, streamlining decision-making processes and ensuring that strategies are based on real-world experiences.
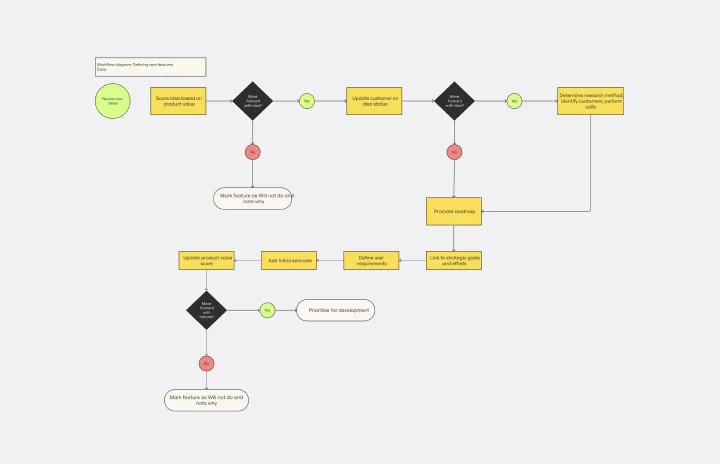
Workflow Diagram Template
Works best for:
Diagramming, Mapping, Process mapping
The Workflow Diagram Template maps out and represents processes or systems using standardized symbols and shapes. By delineating the various steps or stages in a process, it ensures that tasks flow seamlessly from initiation to completion. One of the standout benefits of using this template is its clarity. By translating processes into a visual format, all participants can gain a comprehensive understanding at a glance, eliminating confusion and ensuring everyone is on the same page. This clarity not only promotes efficient task execution but also fosters collaboration among team members.