Cisco Recommended Security Architecture Template
Cisco offers data center and access networking solutions built for scale with industry-leading automation, programmability, and real-time visibility
Trusted by 65M+ users and leading companies


About the Cisco Data Network Diagram Template
Cisco offers data center and access networking solutions built for scale with industry-leading automation, programmability, and real-time visibility. The Cisco Data Network Diagram template can help you design and showcase the organization’s network infrastructure.
Keep reading to learn more about the Cisco Data Network Diagram Template.
What is the Cisco Data Network Diagram Template
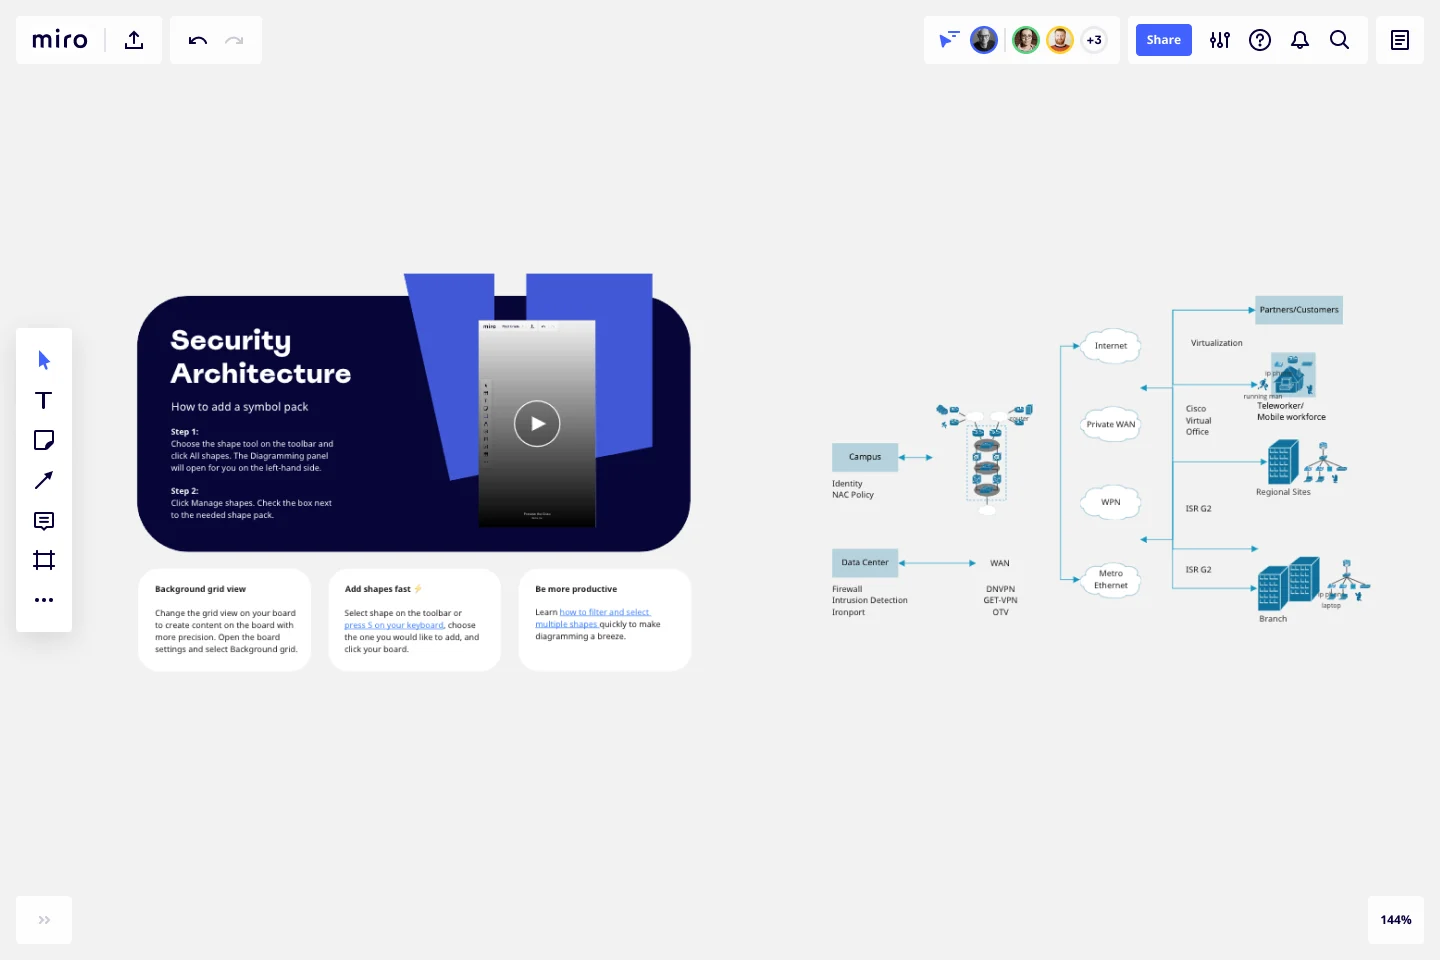
The Cisco Data Network Diagram Template, like any other diagram, visually shows the design of the network infrastructure. The Cisco Data Network Diagram has unique icons and symbols.
When to use Cisco Data Network Diagram Template
You can use the Cisco Data Network Diagram Template to visualize the telecommunication and computer network topology and layout.
Here you can find the semantics of Cisco Data Network Diagrams:
Shapes: Icons represent a Cisco service or product.
Connectors: Use arrows to indicate flows (e.g. data, information, communication). Use a single-headed arrow to indicate a single initiator. Use a double-headed arrow to indicate that the icon shown at either end of the arrow can initiate a flow.
Layout and Grouping: Groups show the connection between multiple services/products and can represent layers of the architecture
Miro's diagramming tool also makes it easy to create your network diagram online with its many shape packs and over 2000 icons that allow you to diagram from scratch.
How do I make a Cisco Data Network Diagram Template?
To make a Cisco Data Network Diagram in Miro is easy. You can use our Cisco Data Network Diagram Template and customize it as you see fit. Once you have the diagram structure, you can start adding the icons. You can find the icons under our Cisco Icon Set integration.
Get started with this template right now.

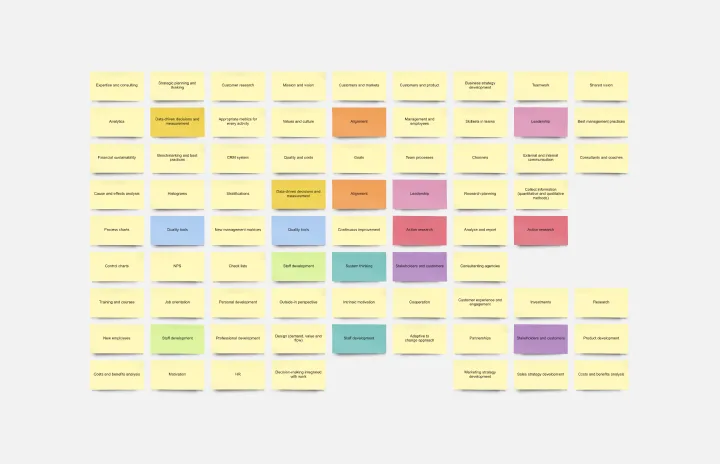
Value Stream Mapping Template
Works best for:
Project Management, Strategic Planning, Mapping
A value stream map can help you refocus your business on steps that actually provide value to your customers, cutting out wasteful and inefficient processes. With this template, you and your process team can collaborate on a value stream map today.
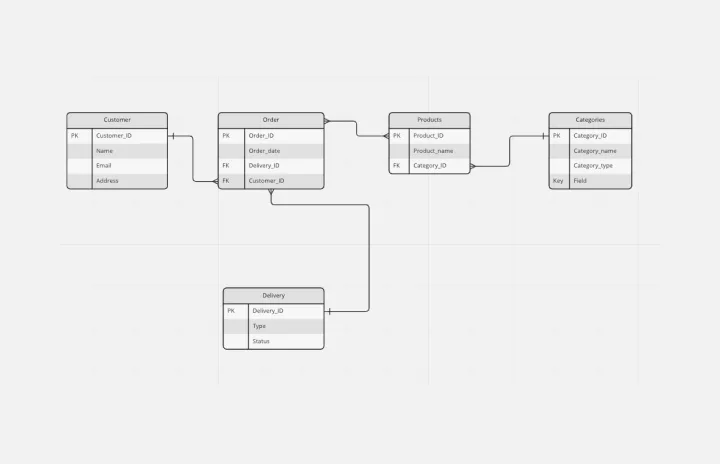
Entity Relationship Diagram Template
Works best for:
Flowcharts, Strategic Planning, Diagrams
Sometimes the most important relationships in business are the internal ones—between the teams, entities, and actors within a system. An entity relationship diagram (ERD) is a structural diagram that will help you visualize and understand the many complex connections between different roles. When will an ERD come in handy? It’s a great tool to have for educating and onboarding new employees or members of a team, and our template makes it so easy to customize according to your unique needs.
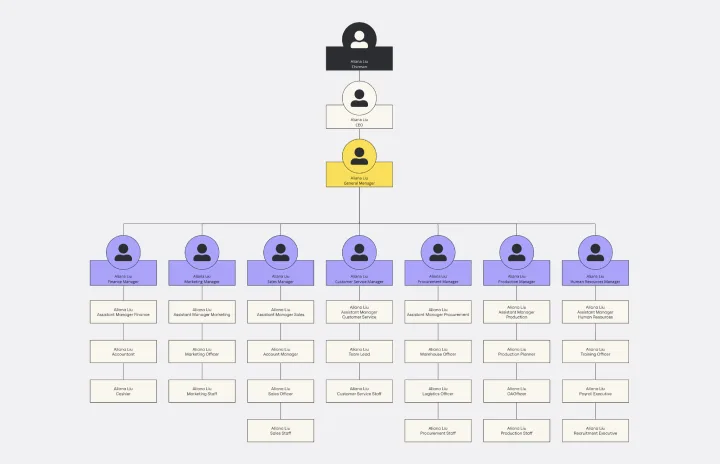
Vertical Organizational Chart
Works best for:
Organizational Charts, Organizational Design
The Vertical Organizational Chart Template is an efficient way to illustrate the hierarchy of an entity in a top-down format. This tool helps represent roles and relationships in a clear manner, starting from the topmost authority and branching downwards. It allows for a better understanding of the flow of responsibilities and communication channels within the organization. One of its most significant advantages is promoting clear communication. Depicting the organization's structure helps avoid misunderstandings and ensures everyone is on the same page regarding the chain of command.
Lotus Diagram Template
Works best for:
UX Design, Ideation, Diagrams
Even creative thinkers occasionally need help getting their creative juices flowing. That's where a lotus diagram comes in. It'll empower you to run smoother, more effective brainstorming sessions. This creative-thinking technique explores ideas by putting the main idea at the diagram center and ancillary concepts in the surrounding boxes. This template gives you an easy way to create Lotus Diagrams for brainstorms, as well as an infinite canvas for the endless ideas generated.
Cloud Blueprint
Works best for:
Diagramming
The Cloud Blueprint template offers a visual framework for designing and planning cloud-based architectures. It provides elements for mapping out cloud services, components, and dependencies. This template enables teams to visualize and communicate complex cloud infrastructure designs, facilitating collaboration and decision-making. By promoting clarity and alignment, the Cloud Blueprint empowers organizations to design scalable, resilient, and secure cloud solutions that meet business requirements and objectives.

Force Field Analysis Template
Works best for:
Diagramming, Strategic Planning
A Force Field Analysis Template is a powerful tool that helps teams identify and analyze the forces supporting or hindering progress toward a specific change or goal. This template provides a visual space where you can brainstorm and plot out 'driving forces' that push objectives forward and 'restraining forces' that prevent advancement, all on a single, intuitive board. One of the primary benefits of utilizing the Force Field Analysis template is that it fosters a shared understanding among team members. By visually mapping out and discussing each force, teams can prioritize efforts, build consensus on the central issues to tackle, and collaboratively devise strategic plans to strengthen positive influences while reducing negative ones.