Swimlane Diagram Template
Bring clarity to your processes and define roles and responsibilities with the swimlane diagram template. Say goodbye to messy workflows and welcome Agile ways of working.
Trusted by 65M+ users and leading companies


About the Swimlane Diagram Template
When processes start to get messy, it’s a good idea to take a step back and visualize who does what and when. Enter: the swimlane diagram template. This digestible, one-stop visual representation uses the metaphor of lanes in a pool to add clarity to complex processes.
A swimlane diagram takes a familiar physical place (a lap pool) and turns it into an analogy for organizing processes within a team, workgroup, department, or multilayered organization.
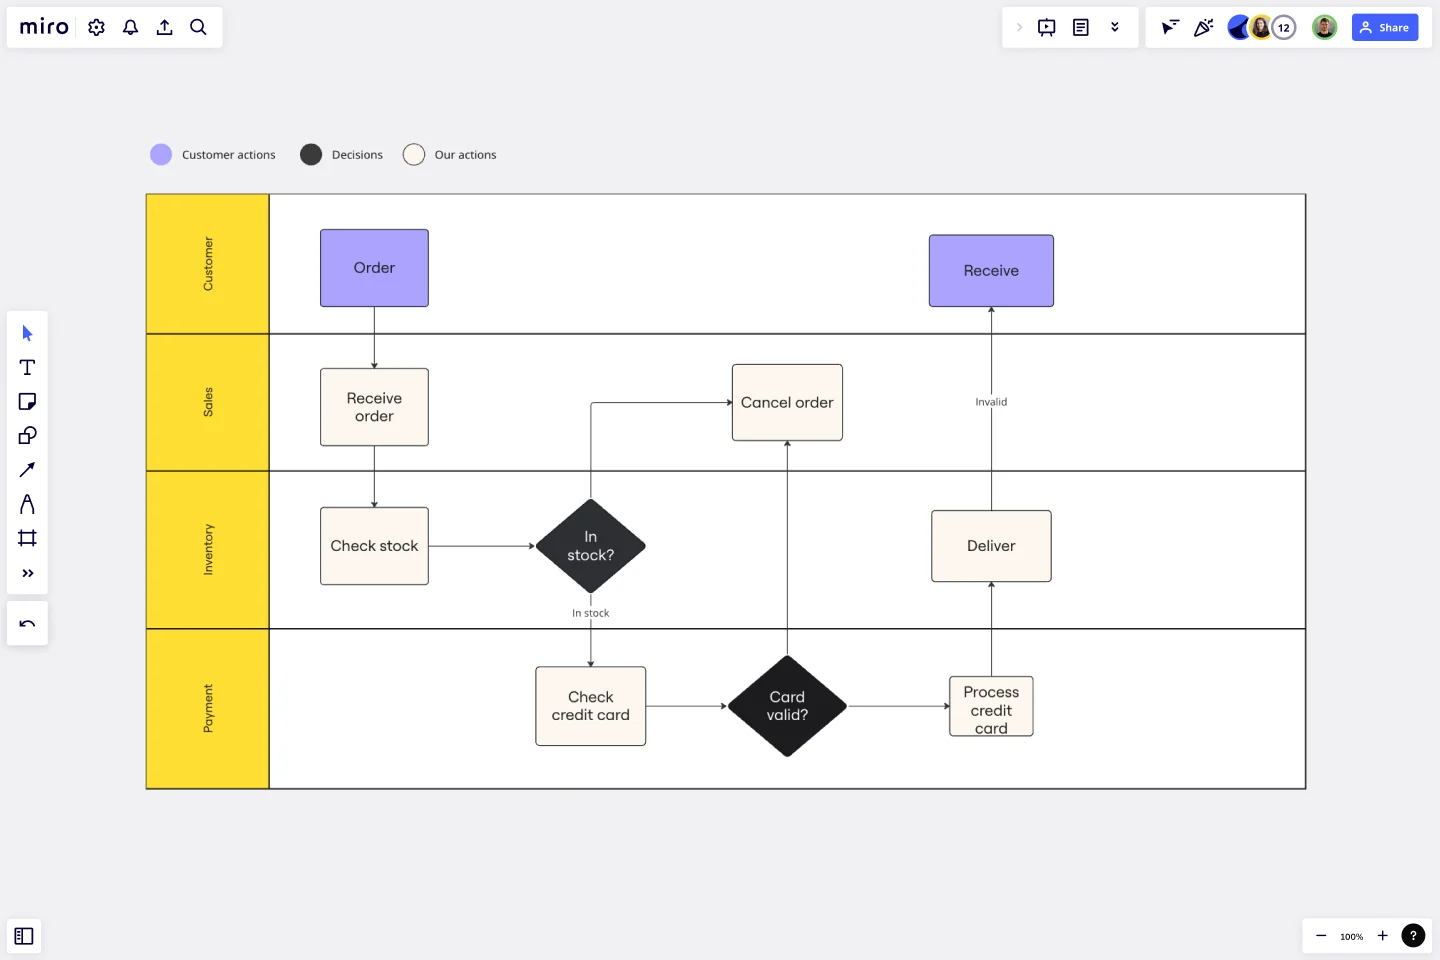
The template is typically divided into several lanes. Each lane is associated with a department, like development, marketing, or sales. Lanes can also correspond to entities outside your company, like customers or third-party vendors. Shapes in the lanes represent all the processes within the scope of the diagram. Arrows show how those objects feed information and/or materials to each other.
In the end, a swimlane diagram template looks like a flowchart but also incorporates elements of an org chart and value stream map (VSM). It shows you what gets done, who does it, and how everything happens.
How to use the swimlane diagram template
Get started by selecting the Miro swimlane diagram template, then follow these steps to make it your own. You can also use Miro's flowchart maker and shapes.
1. Be clear about your goals
Before you start diagramming, determine your desired outcome. Remember that swimlane flowchart templates are best for visualizing how multiple contributors or teams work through the stages of a process.
2. Name your swimlanes and start mapping out a process
Customize the swimlane flowchart by double-clicking shapes. Add the name of each team member, function, or stakeholder. Don’t forget to include outside stakeholders, like customers or contractors.
3. Add arrows to finish your flow mapping
Arrows show the flow of responsibilities from one step to the next. They can stay within lanes or cross lane boundaries. Add an arrow whenever one step triggers another or makes it possible.
Remember that there’s no wrong way to draw your pool. You can use as many lanes as your process demands and arrange them from north to south or east to west.
Why should you use a swimlane template?
Enhanced visibility and clarity: The swimlane diagram template offers a clear and organized visual representation of complex processes. With distinct swimlanes for each participant or department, team members can easily understand the flow of activities. This fosters transparency and reduces the likelihood of misunderstandings.
Efficient workflow management: The template makes streamlining and optimizing processes easier. Assign tasks to specific lanes, identify bottlenecks, and ensure each team member understands their role in the workflow. This boosts efficiency and empowers your team to work cohesively towards common objectives. If you require additional assistance with your swimlane diagram, you may find it helpful to utilize the cross-functional flowchart template.
Collaborative problem-solving: By visually representing tasks, responsibilities, and handovers, teams can spot areas that require attention or improvement. This fosters a culture of innovation and continuous improvement.
Time and resource optimization: Time is a precious commodity in any business. The swimlane template helps you identify areas where time and resources can be optimized. Visualizing the entire process allows you to identify redundant steps, streamline workflows, and allocate resources more efficiently. This improves productivity and allows your team to focus on achieving their goals.
How do you make a Swimlane Diagram?
You can start making your swimlane diagram using Miro's pre-made template. The template helps you to diagram the swimlanes easier, as you can add more rows and columns according to your needs. After you set your swimlane flowchart template, start adding the roles and process steps to it. Then, assign responsible departments or people to the swimlanes and connect the steps with arrows and lines.
Can I collaborate with my team in real time using the swimlane diagram template?
Yes, absolutely! Collaboration is at the core of Miro's design. With the Swimlane Diagram Template, team members can work together in real time, no matter where they are located. Multiple users can edit and contribute simultaneously, creating a dynamic and interactive environment for effective teamwork.
Are any customization options available for the swimlane diagram template?
Yes, the Miro swimlane diagram template is highly customizable. You can personalize the swimlanes, shapes, and text to fit your project or workflow. Choose from various colors, styles, and formatting options to make your diagram visually engaging and tailored to your team's preferences.
Can I export or share the swimlane diagram created in Miro with external collaborators?
Yes, you can! Miro offers seamless sharing and exporting options. Once you've created your swimlane diagram, you can share it with external collaborators by generating a shareable link or inviting them directly to collaborate within Miro. Additionally, you can export your diagram in various formats, such as PDF, PNG, or JPEG, making it easy to integrate into presentations or share with stakeholders outside of the Miro platform.
Get started with this template right now.

BPM
Works best for:
Diagramming
The BPM (Business Process Management) template is a visual tool for modeling, analyzing, and optimizing business processes. It provides a structured framework for documenting process flows, identifying bottlenecks, and improving efficiency. This template enables organizations to streamline operations, enhance productivity, and drive business performance. By promoting process transparency and agility, the BPM template empowers teams to achieve operational excellence and deliver value to stakeholders.
Product Metrics & Analytics
Works best for:
Product Management, Planning
The Compelling Product Offer template assists product teams in defining and measuring key product metrics effectively. By identifying performance indicators, setting benchmarks, and tracking progress, this template enables teams to evaluate the success of product initiatives objectively. With sections for defining KPIs, visualizing data, and analyzing trends, it provides actionable insights for driving product improvements and optimizations. This template serves as a dashboard for monitoring product performance and making data-driven decisions that enhance the overall product offering.
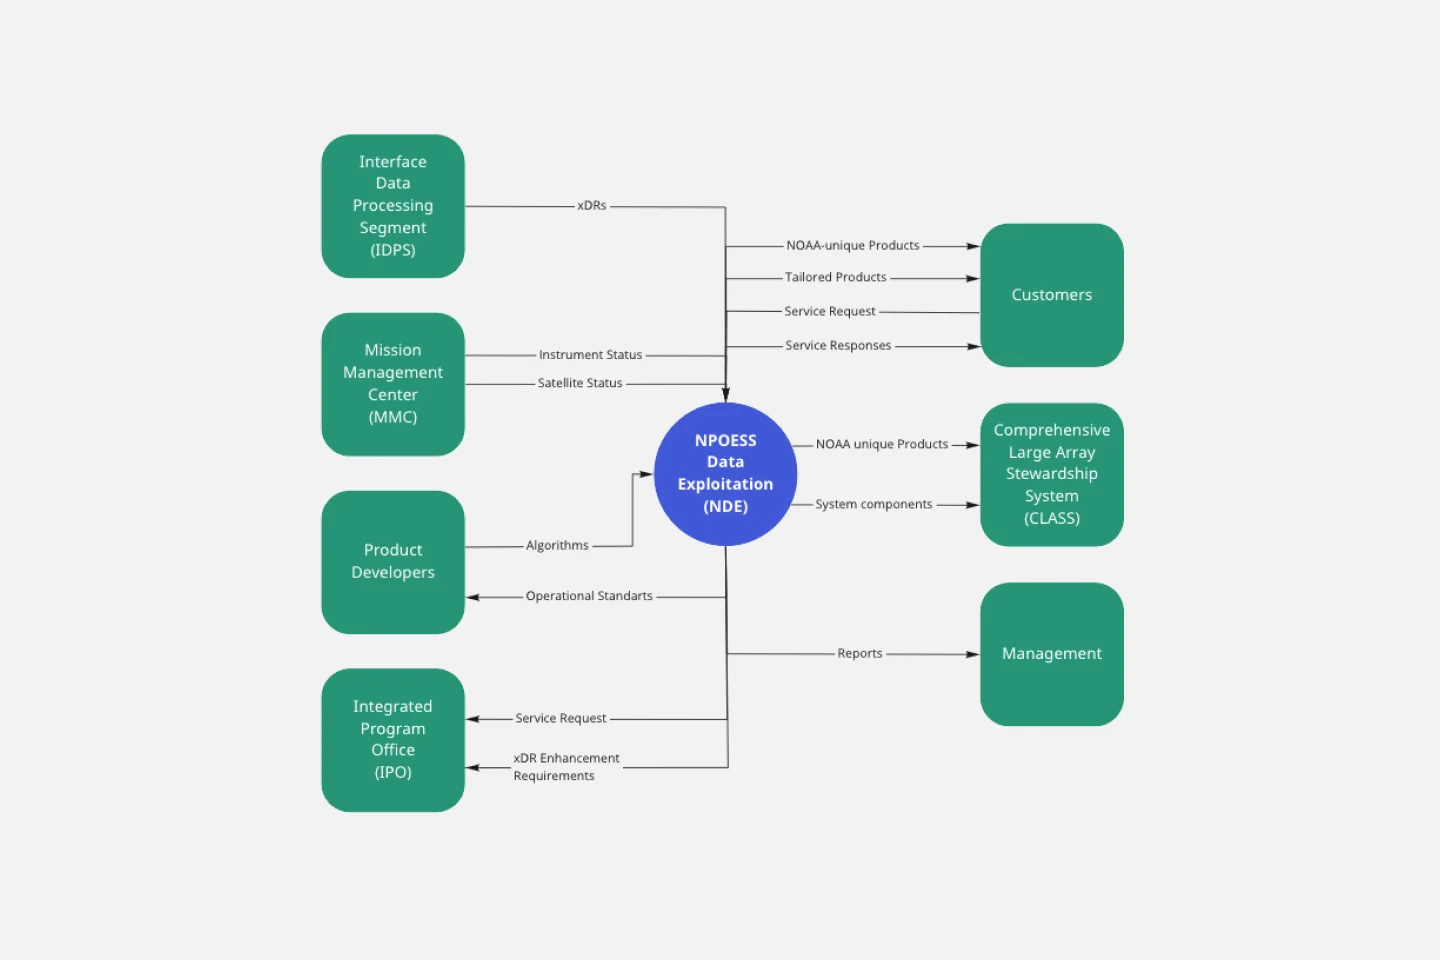
Context Diagram Template
Works best for:
Business Management, Mapping, Diagrams
A context diagram is a perfect tool to view an entire system as a single process and understand how external factors interact with it. These external factors can include customers, developers, management, and more. The Context Diagram Template is your tool for creating this diagram.
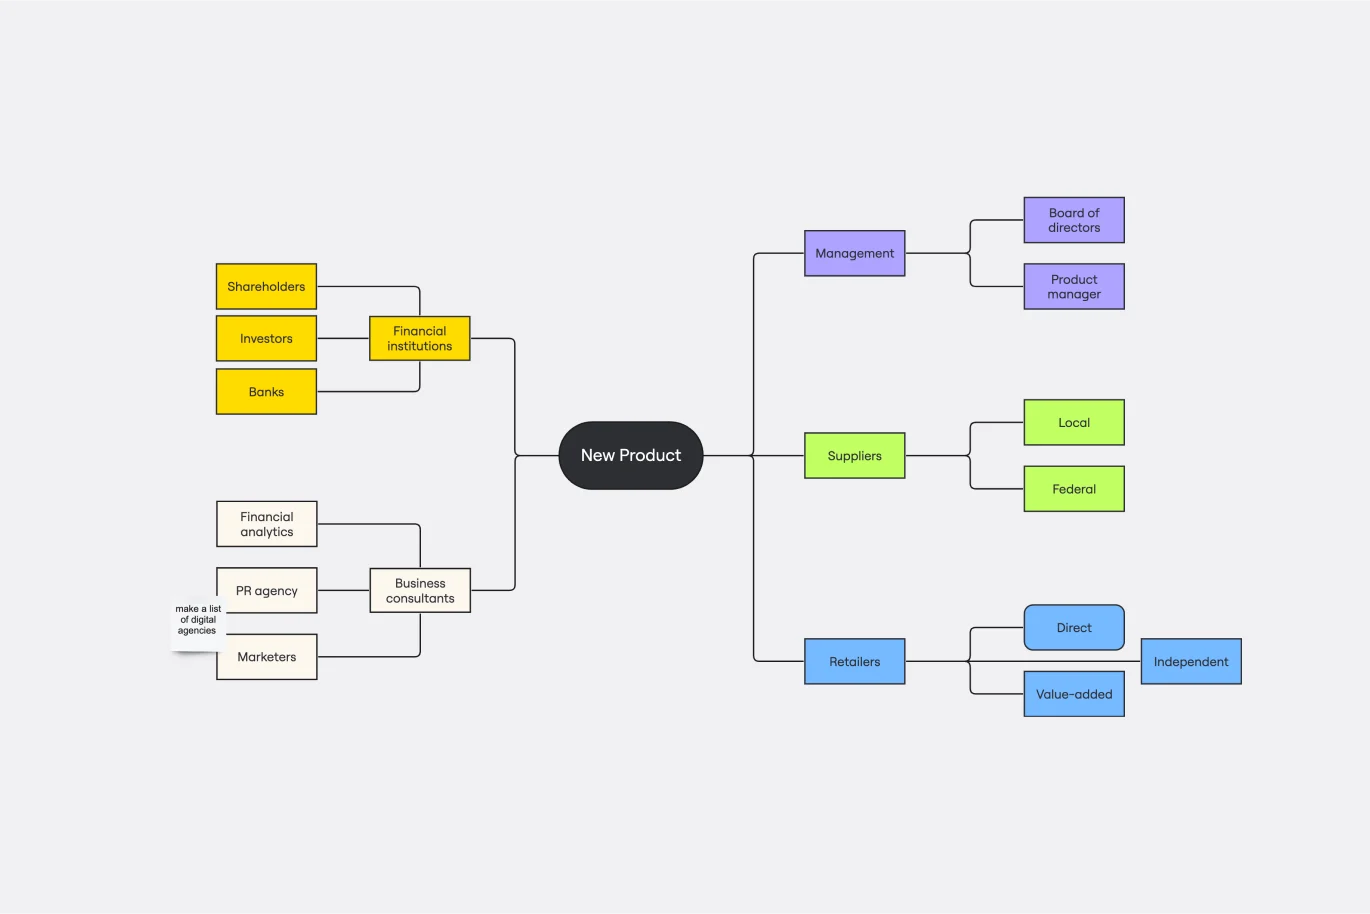
Stakeholder Mapping Template
Works best for:
Business Management, Mapping, Workflows
A stakeholder map is a type of analysis that allows you to group people by their power and interest. Use this template to organize all of the people who have an interest in your product, project, or idea in a single visual space. This allows you to easily see who can influence your project, and how each person is related to the other. Widely used in project management, stakeholder mapping is typically performed at the beginning of a project. Doing stakeholder mapping early on will help prevent miscommunication, ensure all groups are aligned on the objectives and set expectations about outcomes and results.
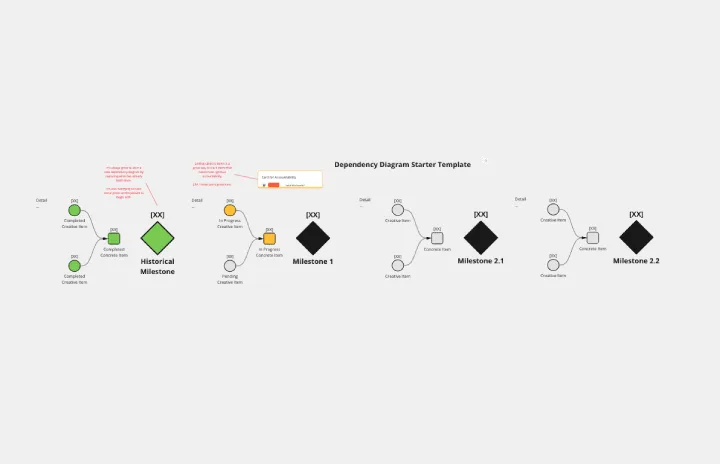
Dependency Diagrams Educational Board
Works best for:
Diagramming
The Dependency Diagrams Educational Board template provides a visual tool for teaching and learning about dependency relationships between components in systems. It offers a structured framework for illustrating dependencies, connections, and interactions within a system or process. This template enables educators to explain complex concepts effectively and engage learners in interactive activities. By promoting visual learning and understanding of dependencies, Dependency Diagrams empower students to grasp fundamental principles of systems thinking and analysis.
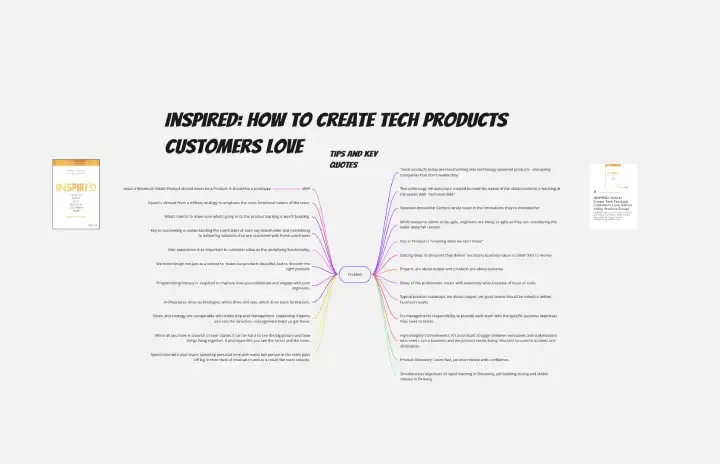
Inspired: Creating Products Customers Love
Works best for:
Product Management, Planning
Inspired: Creating Products Customers Love template guides product managers in developing innovative and customer-centric products. By emphasizing empathy, ideation, and validation, this template fosters a deep understanding of customer needs and preferences. With sections for brainstorming ideas, defining features, and validating concepts, it facilitates the creation of compelling products that resonate with target audiences. This template serves as a roadmap for delivering exceptional customer experiences and driving product success.