SIPOC Template
Identify all the relevant elements of a process improvement plan. Use the SIPOC template to document the working process from beginning to end.
Trusted by 65M+ users and leading companies


About the SIPOC Diagram Template
The SIPOC model brings transparency and alignment to a process. This template offers a quick, convenient way to create a SIPOC diagram with minimal fuss. Use this visual tool to document the inputs and outputs of a process and share the final product with the rest of your team.
What is a SIPOC diagram?
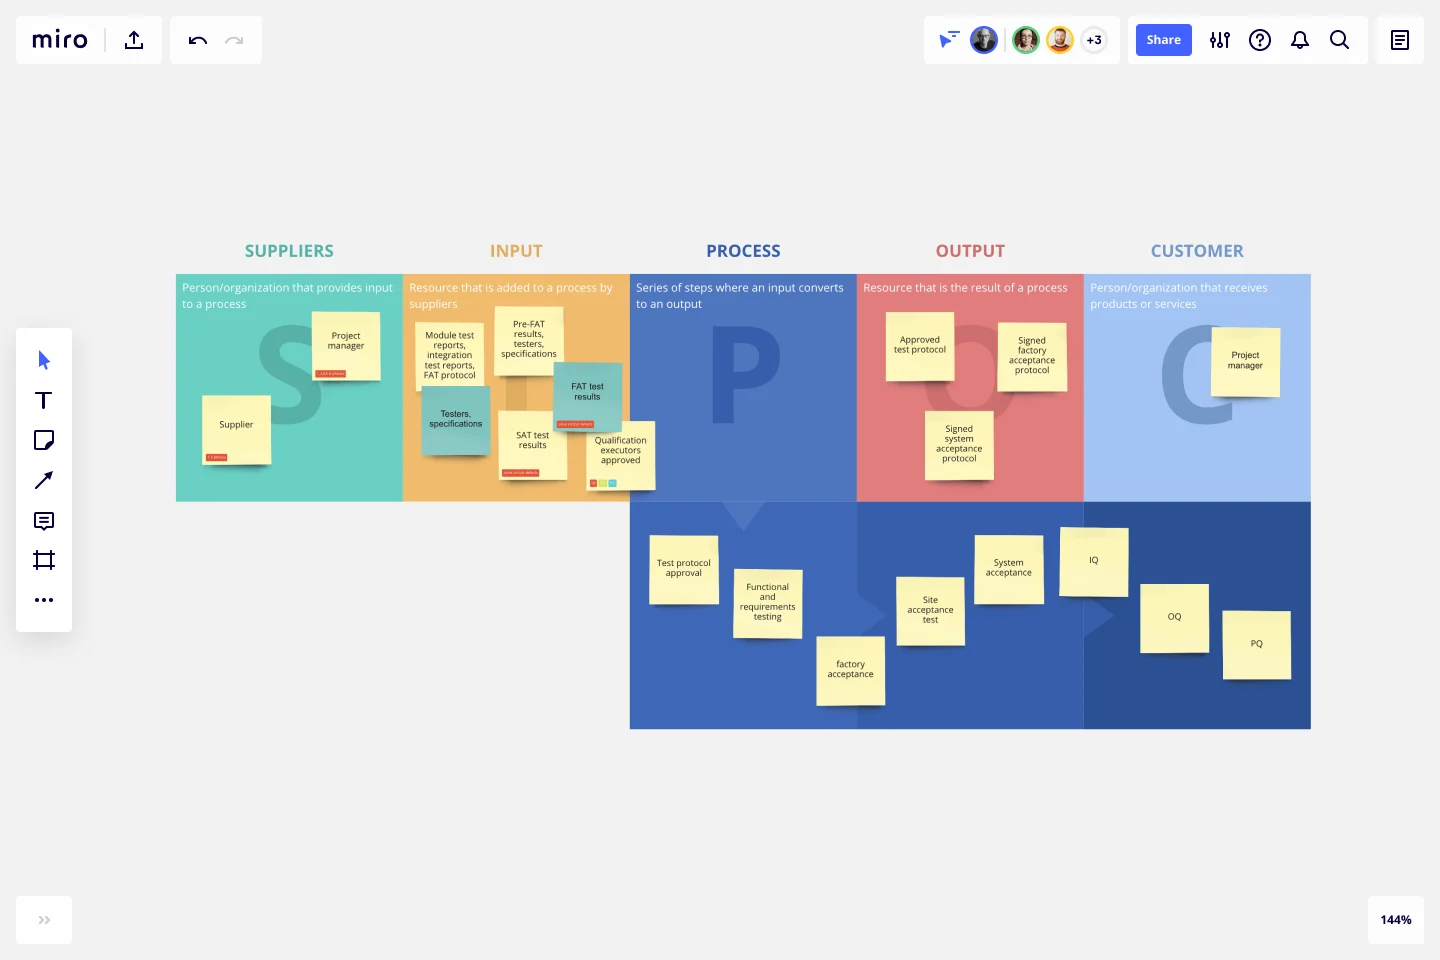
A SIPOC diagram enables you to summarize the inputs and outputs of a process in the form of a customized table. This allows teams to identify relevant aspects of a process improvement project before starting work. SIPOC is useful when defining a complicated project that isn't necessarily well-scoped.
SIPOC is an acronym for Suppliers, Inputs, Process, Outputs, and Customers. The name invites the team to think about the suppliers of your process, the inputs to the process, the process itself, the outputs that you produce, and the customers who receive those outputs.
A SIPOC diagram can help you answer questions like:
Who supplies inputs to this process?
Who are the customers?
What are their needs?
What specifications are placed on inputs?
How to use the SIPOC diagram template in Miro
Here’s a step-by-step walkthrough of how to use the SIPOC diagram template to create your own diagram:
The SIPOC diagram template has the following sections under each letter:
S for suppliers
I for inputs
P for process
O for outputs
C for customers
Add the relevant information under each section with sticky notes, text, or any other artifact you see fit.
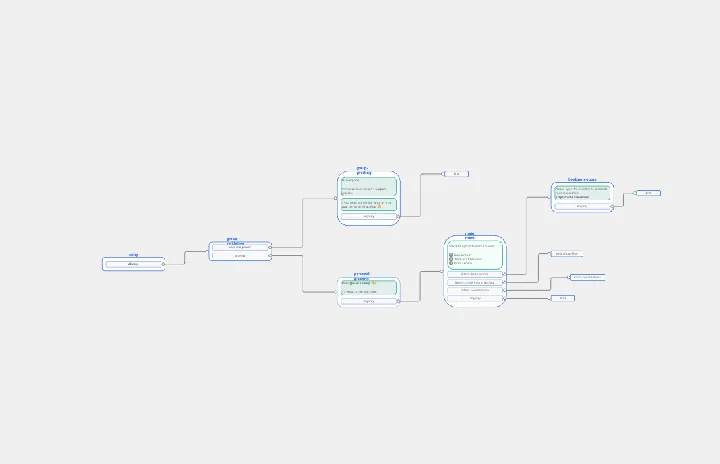
The Process section is organized so you can map a process chain, allowing information to be quickly and easily entered. Since the idea is to identify each step in a process from start to finish, others can add steps in an automatically growing chain.
Once the first step is identified, the blue circle can be clicked to automatically add another step in the process. This can be repeated until all steps of the process have been entered. The process will then be displayed in an easily understood visual format.
Benefits of using a SIPOC diagram template
Here’s how your team can benefit from using the SIPOC template:
Visual planning: A SIPOC diagram is a great tool for bringing a process into focus before any actions are taken. It offers an excellent preproduction stage that allows issues to be ironed out in advance.
Streamline processes: A SIPOC diagram can act as an improvement tool for processes or projects that have already been completed. Even if the process or workflow was a success, the diagram still provides an easy way to find areas for improvement.
Enhanced communication: Project teams and individuals are made aware of all aspects of the project or process in an easily understood and quickly digested visual tool format. The SIPOC template provides a full perspective for your team on a single page.
Better collaboration: The tool helps your team identify all persons or organizations providing input into a process. This helps everyone understand what input they are providing and how that input relates to all other aspects of the process.
Customer-centric: Customer requirements aren't only identified, but specific expectations are also highlighted. Therefore, all parties involved can appreciate the ultimate goal of the process and aim toward it more efficiently.
What is SIPOC used for?
The SIPOC Diagram is used to plot out the various steps of a process. It includes everyone involved in the process, as well as specific customer requirements. The diagram can serve either to effectively visualize a process before it is acted on or to improve a process that's already in effect. It isn't necessary to include detailed steps when creating a diagram but rather to identify all persons and parties involved.
What do I do after SIPOC?
Depending on what the SIPOC Diagram is used for, the steps that follow will differ. If the diagram was used to plan a process, the next step would be implementation. This would include contacting relevant parties, informing them of the strategy, and moving forward into action. It’s a good idea to provide all parties with the finished SIPOC Diagram for reference. If the SIPOC Diagram was used to improve an existing process, the next steps would be to inform all parties involved of any inefficiencies or problems uncovered and agree steps to tackle them. Again, providing the diagram would be necessary.
What is the difference between SIPOC and a process map?
A SIPOC diagram is different from a process map, otherwise called a flow chart, in several ways. Essentially, a process map is a simplified version of a SIPOC diagram, identifying only the steps involved in a process. A SIPOC Diagram aims to identify the process and the parties involved in each step.
Can I collaborate with others using a SIPOC diagram template?
Yes, collaboration is often encouraged when creating a SIPOC diagram. Input from various team members and stakeholders can provide a more comprehensive understanding of the process.
Can a SIPOC diagram be used in various industries?
Yes, SIPOC diagrams are versatile and can be applied across different industries, including manufacturing, services, healthcare, and more.
Get started with this template right now.
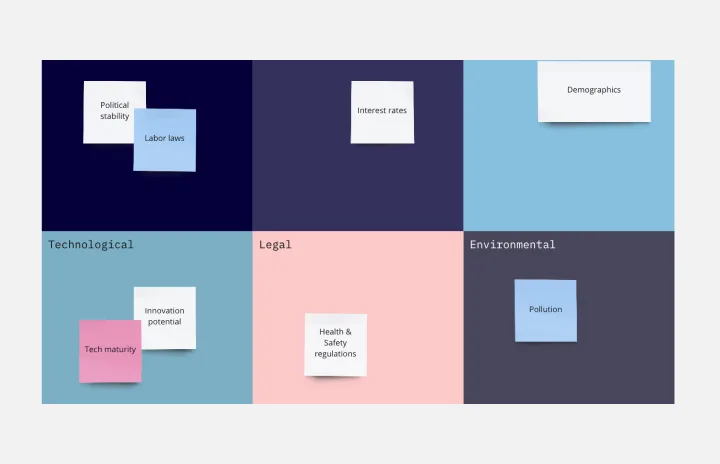
PESTLE Analysis Template
Works best for:
Ideation, Strategic Planning, Business Management
Want to keep your company secure and performing soundly? You have to first know how you’ll be affected by outside elements and factors — especially those that are political, economic, social, technological, legal and environmental in nature. A PESTLE Analysis helps you identify them and prepare for them. With this easy-to-use template, you can conduct a PESTLE Analysis, then use the results to shape your strategic planning, budget allocation, marketing, product updates, and organizational change initiatives.
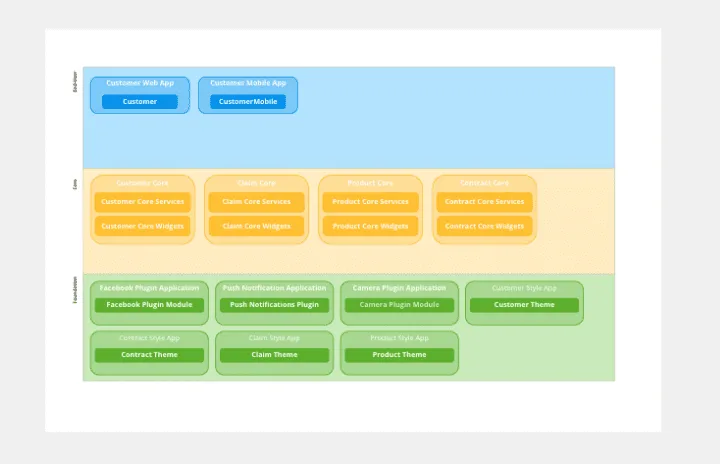
OutSystems Architecture Diagram
Works best for:
Diagramming
The OutSystems Architecture Diagram template offers a visual tool for designing and documenting software architectures using the OutSystems platform. It provides elements for modeling application components, data structures, and integration points. This template enables teams to visualize and communicate the architecture of their OutSystems applications, facilitating collaboration and alignment among developers and stakeholders. By promoting clarity and understanding of system architecture, the OutSystems Architecture Diagram empowers teams to build scalable, maintainable, and high-performance applications effectively.
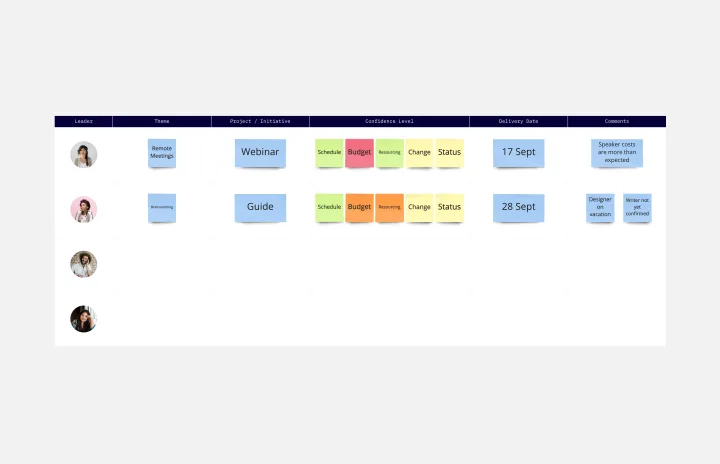
Status Report Template
Works best for:
Project Management, Documentation, Strategic Planning
A status report provides a snapshot of how something is going at a given time. You can provide a status report for a project, a team, or a situation, as long as it emphasizes and maps out a project’s chain of events. If you’re a project manager, you can use this report to keep historical records of project timelines. Ideally, any project stakeholder should be able to look at a status report and answer the question, “Where are we, and how did we get here?” Use this template as a starting point to summarize how something is progressing against a projected plan or outcome.
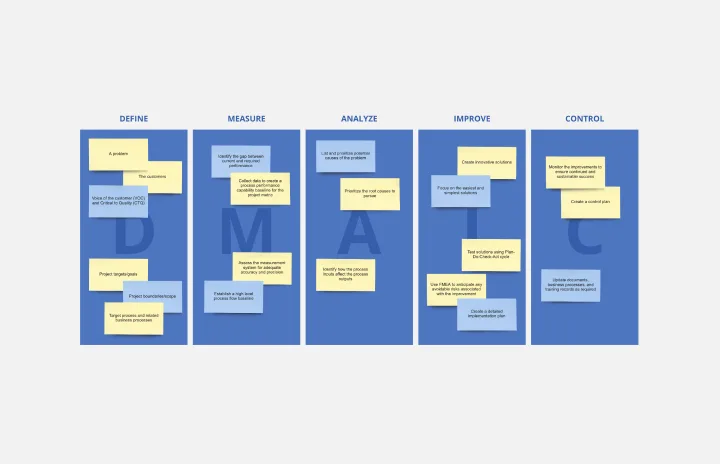
DMAIC Analysis Template
Works best for:
Agile Methodology, Design Thinking, Operations
Processes might not seem like the funnest thing to dive into and examine, but wow can it pay off—a more efficient process can lead to serious cost savings and a better product. That’s what DMAIC analysis does. Developed as part of the Six Sigma initiative, DMAIC is a data-driven quality strategy for streamlining processes and resolving issues. The technique is broken into five fundamental steps that are followed in order: Define, Measure, Analyze, Improve, and Control.

PI Planning Template
Works best for:
Agile Methodology, Strategic Planning, Software Development
PI planning stands for “program increment planning.” Part of a Scaled Agile Framework (SAFe), PI Planning helps teams strategize toward a shared vision. In a typical PI planning session, teams get together to review a program backlog, align cross-functionally, and decide on the next steps. Many teams carry out a PI planning event every 8 to 12 weeks, but you can customize your planning schedule to fit your needs. Use PI planning to break down features, identify risks, find dependencies, and decide which stories you’re going to develop.
Chat-Bot
Works best for:
Diagramming
The Chat Bot template is a visual tool for designing and mapping out chatbot interactions and functionalities. It provides a structured framework for visualizing conversation flows, user inputs, and bot responses. This template enables teams to collaborate on designing chatbot experiences that are intuitive and user-friendly, driving engagement and satisfaction. By promoting clarity and alignment, the Chat-Bot template empowers organizations to create effective chatbot solutions that meet user needs and business objectives.