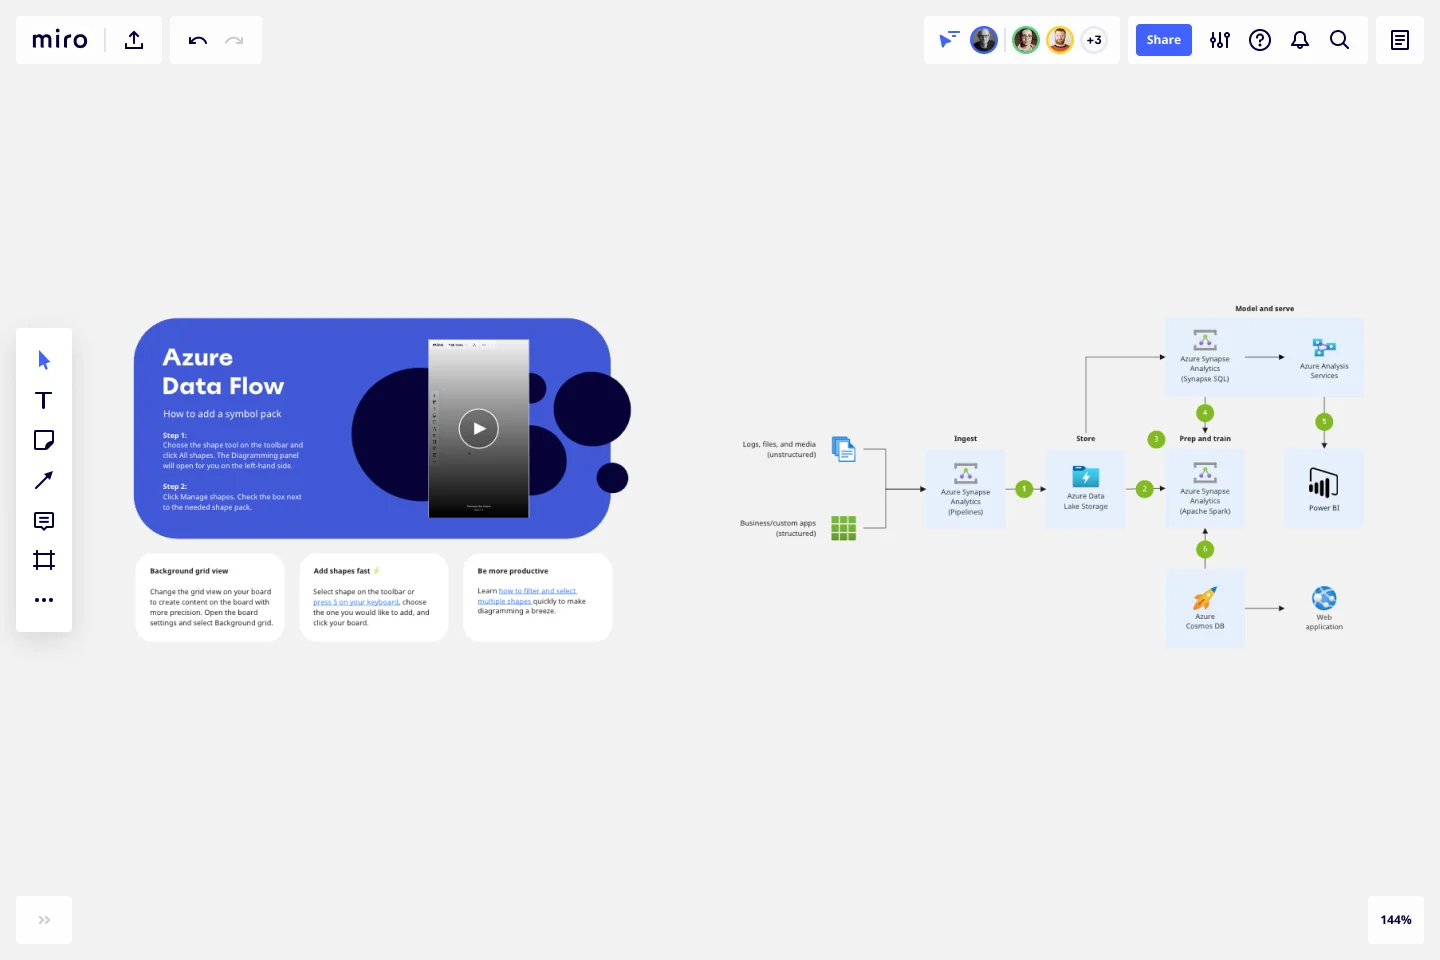
Azure Data Flow Template
The Azure Data Flow is a diagram that will allow you to combine data and build and deploy custom machine learning models at scale.
Trusted by 65M+ users and leading companies


About the Azure Data Flow Template
The Azure Data Flow Template will show you how to transform your data into actionable insights using the best-in-class machine learning tools. This architecture allows you to combine data and build and deploy custom machine learning models at scale.
Keep reading to learn more about the Azure Data Flow Template.
What is an Azure Data Flow Template
The Azure Data Flow Template visually shows the data flow to deploy and build custom machine learning models. The Azure Data Flow Template has unique icons categorized into Stencils. Each Stencil focuses on a specific task to make it easier for users to access the right set of icons.
When to use Azure Data Flow Template
You can use the Azure Data Flow Template to transform your data into actionable insights and better inform decision making. Collect data, analyze it, and use it to make decisions surrounding your architecture, from cost data, to performance, to user load, using data will guide you to make the right choices in your environment.
To build your Azure Data Flow Template, check out these best practices:
Do’s
Use the icon to illustrate how products can work together
In diagrams, we recommend to include the product name somewhere close to the icon
Use the icons as they would appear within Azure
Don’ts
Don’t crop, flip or rotate icons
Don’t distort or change icon shape in any way
Don’t use Microsoft product icons to represent your product or service.
How do I make an Azure Data Flow Template?
To make an Azure Data Flow in Miro is easy. You can use our Azure Data Flow Template and customize it as you see fit. Once you have the diagram structure, you can start adding the icons. You can find the icons under our Azure Icon Set integration.
Get started with this template right now.
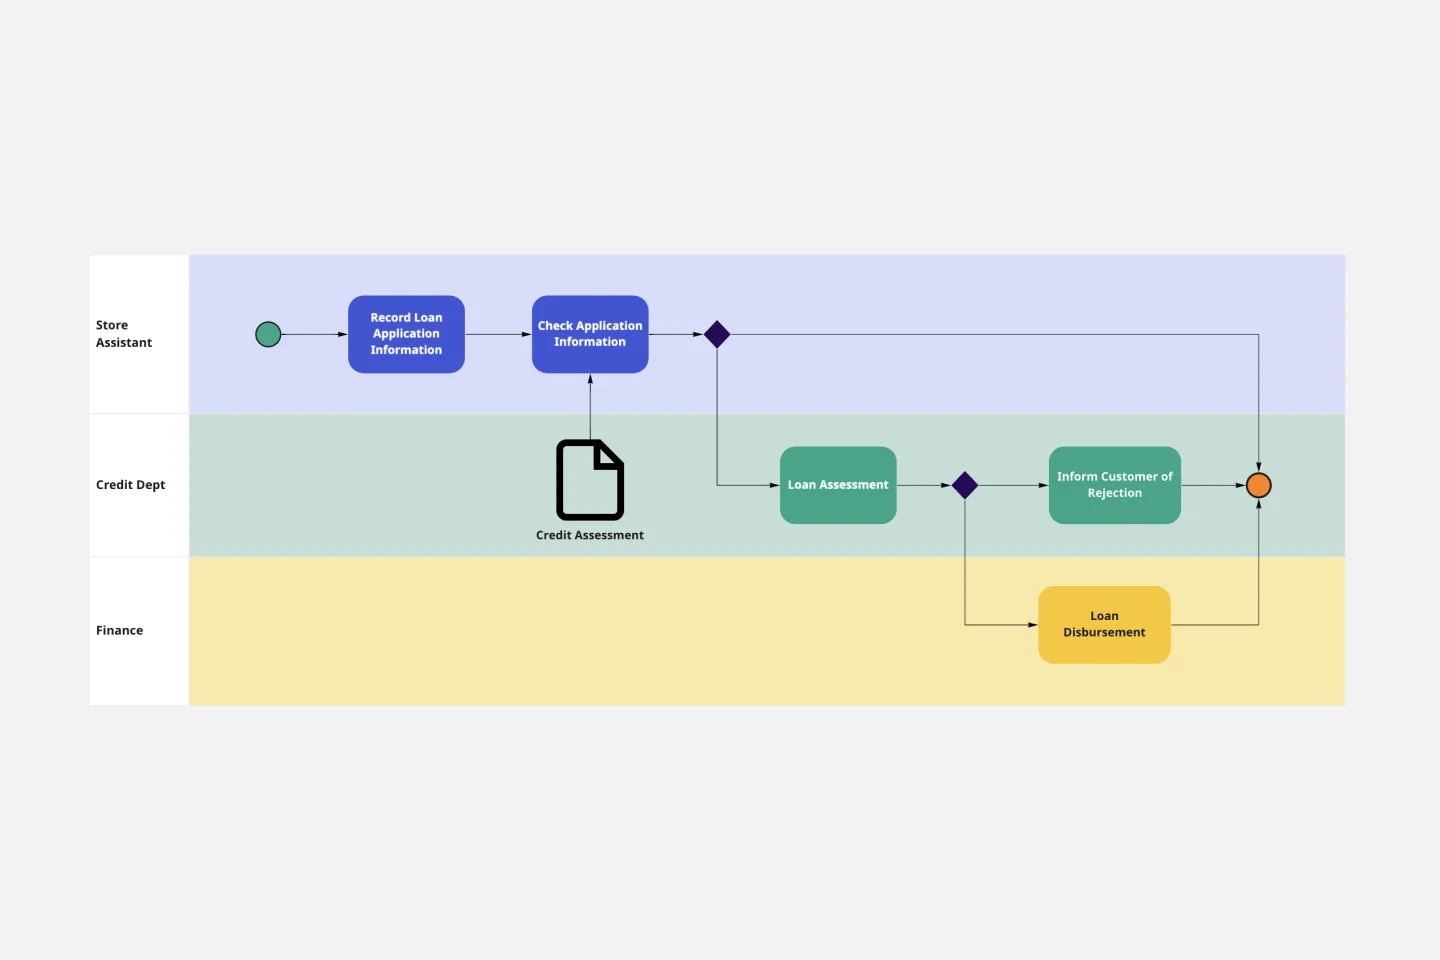
BPMN Template
Works best for:
Mapping, Diagrams, Business Management
The BPMN template helps you track and get an overview of your business processes. It’s a great way to identify any bottlenecks and make your operations more efficient. The BPMN methodology became a universal language when managing business processes, and multiple industries use it as a management tool. Project managers, business analysts, and IT administrators use the BPMN process flow diagram to manage projects, visually communicate the process flows, and keep track of process constraints. Try it for yourself and see improvements in your organization’s agility.
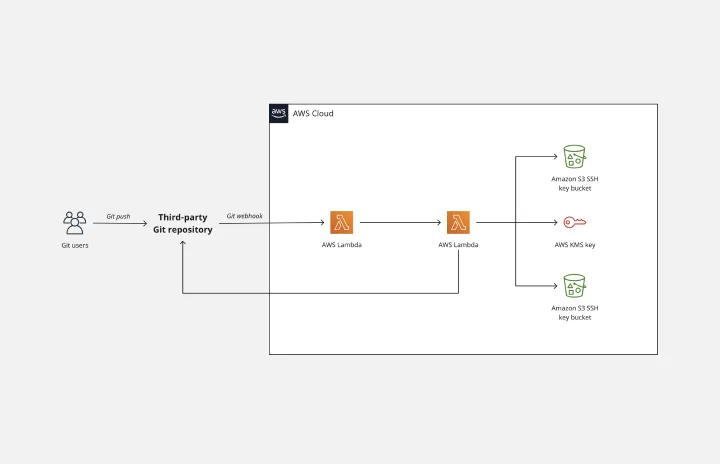
AWS Git to S3 Webhooks Template
Works best for:
Software Development, Diagrams
The AWS Git to S3 Webhooks Template is a visual representation of Git webhooks with AWS services Quick Start architecture. You can now have an overview of your AWS architecture with Miro’s AWS Git to S3 Webhooks Template, track your cloud solutions easily, and optimize processes like never before.
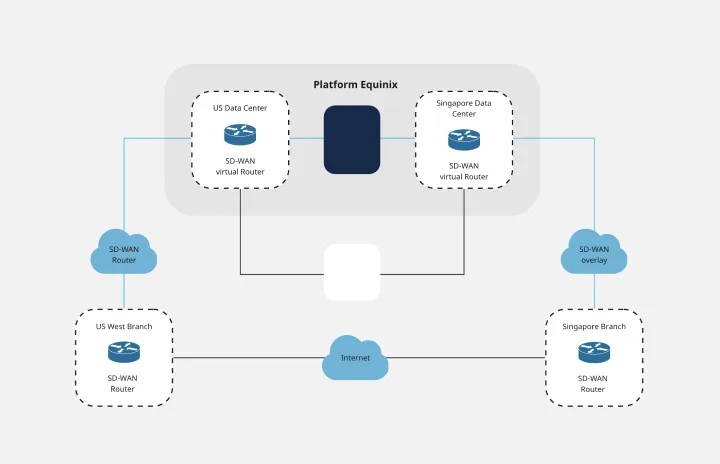
Cisco Data Network Diagram Template
Works best for:
Software Development
Cisco offers data center and access networking solutions built for scale with industry-leading automation, programmability, and real-time visibility. The Cisco Data Network Diagram uses Cisco elements to show the network design of Cisco Data Networks visually.
Cost-Benefit Analysis Template
Works best for:
Leadership, Decision Making, Strategic Planning
With so many day-to-day decisions to make—and each one feeling high-stakes—it’s easy for all the choices to weigh a business or organization down. You need a systematic way to analyze the risks and rewards. A cost benefit analysis gives you the clarity you need to make smart decisions. This template will let you conduct a CBA to help your team assess the pros and cons of new projects or business proposals—and ultimately help your company preserve your precious time, money, and social capital.
Kaizen Report Template
Works best for:
Agile Methodology, Operations, Documentation
What makes a great company great? They know that greatness needs to be fostered and maintained — meaning they never stop working to improve. If you’re one of those companies (or aspire to be), a kaizen report is an ideal tool. It creates a simple visual guide to continuous improvement activities on a team, departmental, and organizational level. Using a kaizen report approach, every employee in an organization audits their own processes and understands what they might have overlooked, making this a powerful tool for increasing accountability at all levels.

Azure Demand Forecasting Template
Works best for:
Software Development, Diagrams
The Azure Demand Forecasting diagram will show the architecture of a demand forecast, making it easier for you to predict data consumption, costs, and forecast results. Azure is Microsoft’s cloud computing platform, designed to provide cloud-based services such as remote storage, database hosting, and centralized account management. Azure also offers new capabilities like AI and the Internet of Things (IoT).