4-Circle Venn Diagram Template
Use the 4-Circle Venn Diagram Template to visualize complex relationships between data sets. Empower your team's collaboration and communication with this powerful tool today.
Trusted by 65M+ users and leading companies


About the 4-Circle Venn Diagram Template
The 4-Circle Venn Diagram Template is a powerful visual tool to help you effectively map out and explore different aspects of your concepts, ideas, or problems. Simplify complex information, create clear intersections, and foster better understanding by creating a 4-Circle Venn diagram. Whether you are brainstorming, analyzing data, or seeking overlaps between multiple elements, our 4-Circle Venn Diagram Template has got you covered.
What's a 4-Circle Venn Diagram Template?
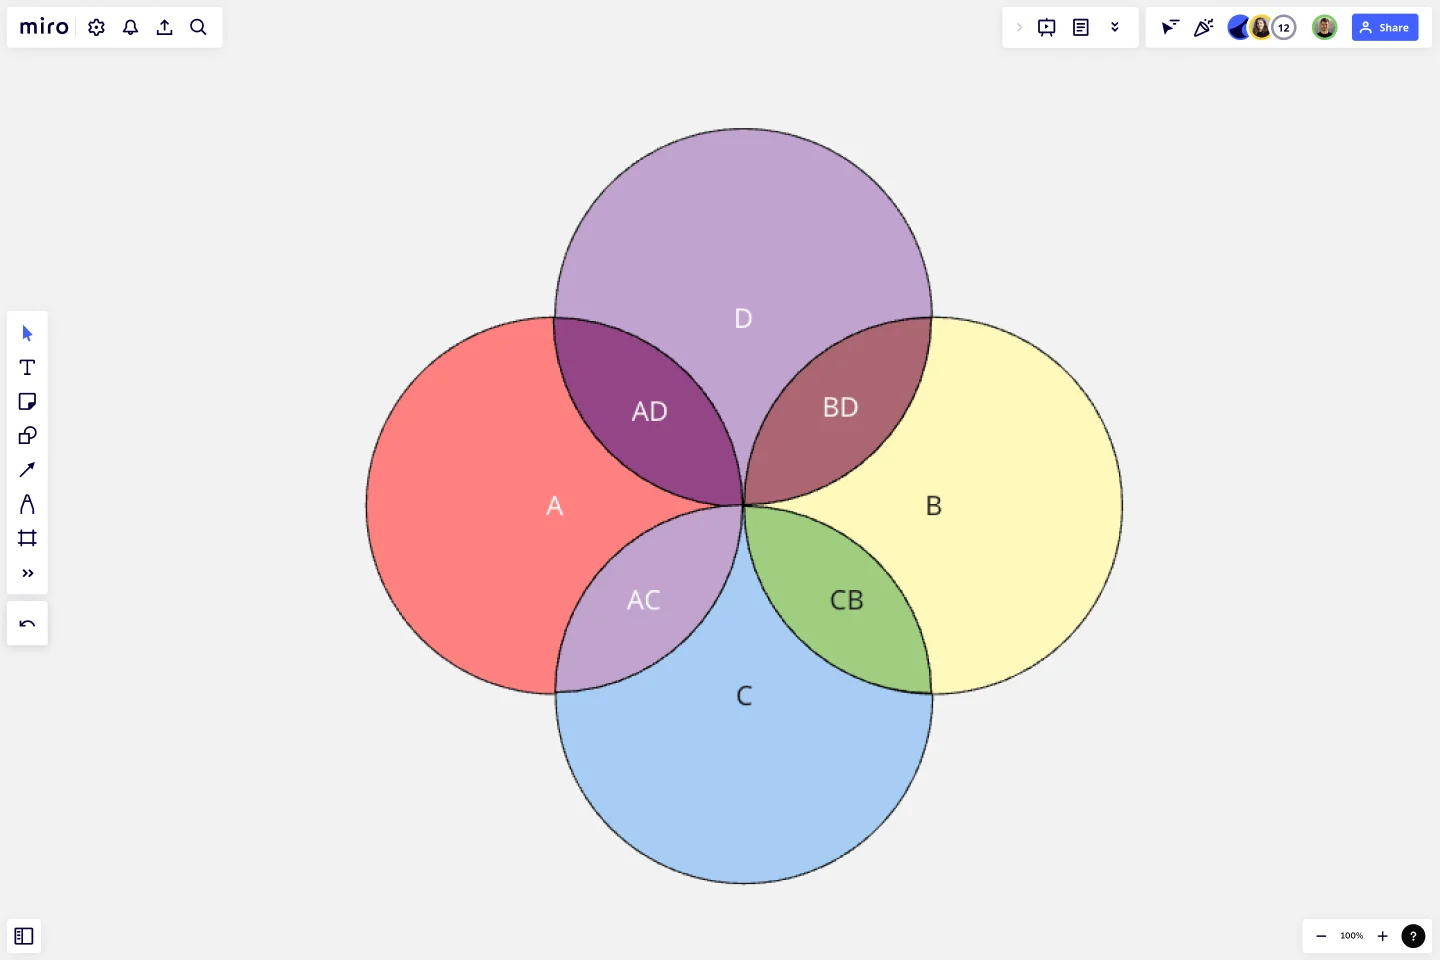
A 4-Circle Venn Diagram Template is a visual representation showcasing the relationships between four different data sets. Each circle in the diagram represents a unique set, and the areas where they intersect signify commonalities. This dynamic tool allows for easy comparison and contrast of information, making it a powerful aid in decision-making processes, problem-solving, data visualization, and more.
How to use a 4-Circle Venn Diagram Template in Miro
Step 1: Select the 4-Circle Venn Diagram Template. It will automatically load on your board.
Step 2: Customize your Venn diagram by clicking on each circle to edit the text. Input your specific sets of data into each circle.
Step 3: To show intersections and commonalities between your data sets, drag and adjust your circles so that they overlap in the necessary areas.
Step 4: Invite team members to collaborate by sharing the board with them. They can join in real-time to add comments, feedback, and ideas directly onto the Venn diagram.
Remember, with Miro, all changes are automatically saved, so you can return and change your diagram anytime. Enjoy creating a visual representation of your data that's both clear and engaging.
Miro is the perfect Venn diagram maker with a range of available templates and the ability to customize everything, from the number of circles to labeling and colors. Create professional Venn diagrams that will help you explain complex topics with confidence.
Can I customize the 4 Circle Venn Diagram Template in Miro?
Absolutely! Miro's templates are fully customizable. You can change your circles' colors, sizes, fonts, and arrangement. This allows for a truly tailored and personalized visualization experience.
Can multiple team members work on the Venn diagram simultaneously?
Yes, Miro's platform supports real-time collaboration. This means multiple team members can work on the Venn diagram simultaneously, making it perfect for brainstorming sessions or collaborative meetings.
Can I save and share my 4 Circle Venn Diagram?
Yes, you can easily save your work on your Miro board. To share it with others, simply use the share button to generate a link, or export your diagram as an image or PDF.
How can I use the 4 Circle Venn Diagram in a presentation?
Miro's 4 Circle Venn Diagram Template can easily be integrated into presentations. Use the frame tool to create a slide with your Venn Diagram, then present directly from Miro or export your frame as an image to insert into a presentation deck.
Get started with this template right now.

Onion Diagram Template
Works best for:
Diagramming, Mapping and Diagramming
The Onion Diagram Template is a distinct tool designed to visually represent layers of a specific concept, system, or process, akin to the layers of an onion. Each concentric layer of the diagram provides insights into a different aspect or phase of the topic at hand, moving from the core foundational element outwards to more peripheral components. One of the prime benefits of this template is its ability to offer hierarchical clarity. Users can immediately discern the importance, sequence, or interrelation of different elements within a system, facilitating enhanced comprehension and efficient decision-making.
GenAI Application Workflow
Works best for:
Flowcharts, Mapping, Diagrams
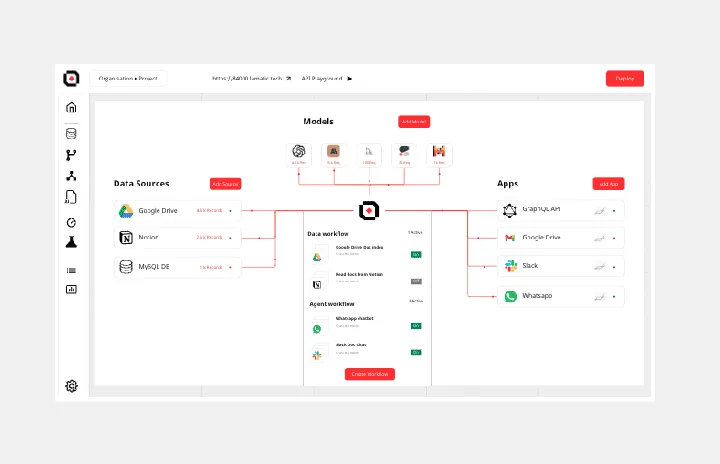
The GenAI Application Workflow template is a visual tool for mapping out the workflow of applications developed using GenAI. It provides elements for defining process steps, decision points, and data flows within the application. This template enables developers and project teams to visualize the application workflow, identify potential bottlenecks, and optimize the user experience. By promoting clarity and efficiency in application development, the GenAI Application Workflow empowers teams to deliver innovative and user-friendly applications effectively.
Supply and Demand Graph Template
Works best for:
Market Research, Mapping, Diagrams
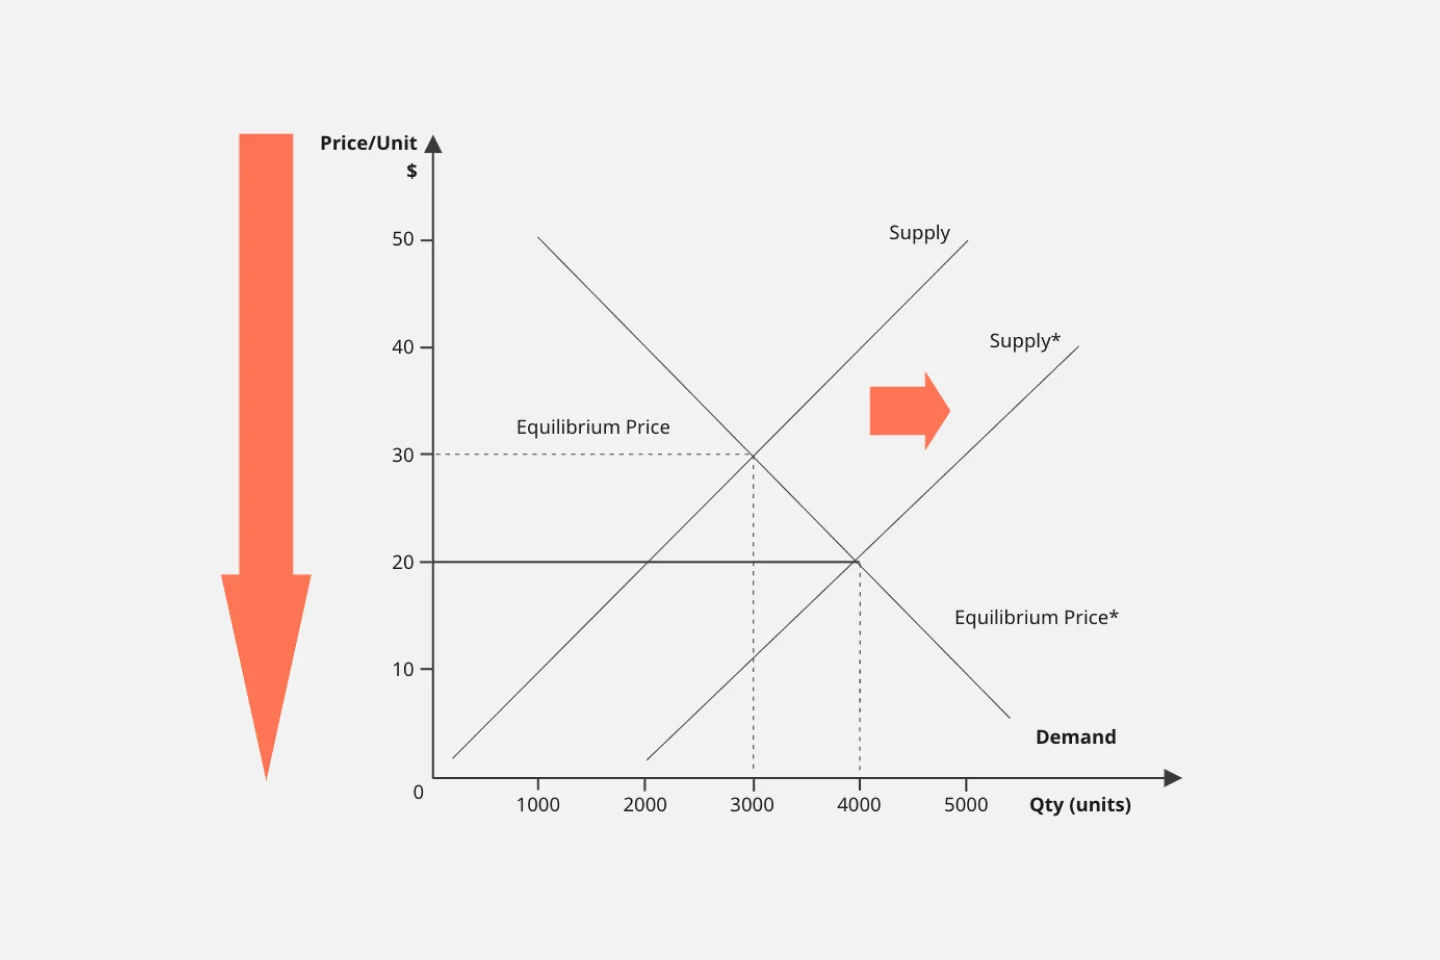
How do you price your product so that you make a profit while keeping customers and manufacturers happy? By finding a fair price. A supply and demand diagram is a graph that visualizes how much demand there is for your product and how many products you need. This, in turn, helps you with product pricing.
Kubernetes Architecture Diagram Template
Works best for:
Software Development, Diagrams
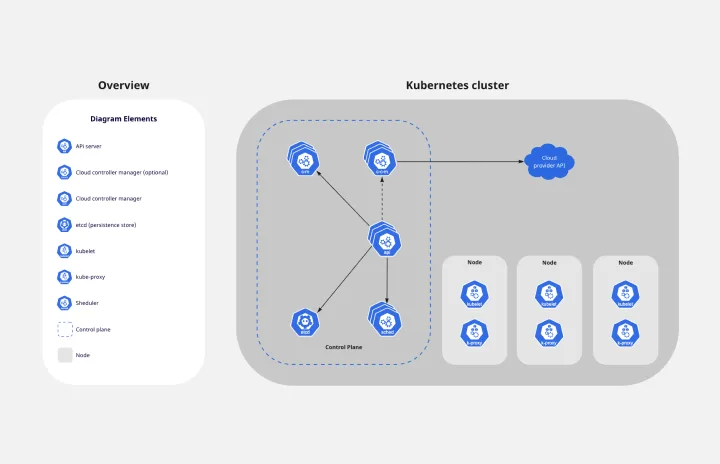
Use the Kubernetes Architecture Diagram template to manage your containerized applications better and bring your apps’ deployment, management, and scalability to the next level. This template helps you lower the downtime in production and allows you to have a more agile app production. Improve the deployment of your apps by visualizing every step of the process with the Kubernetes Architecture template. Try it out, and see if it works for you and your team.
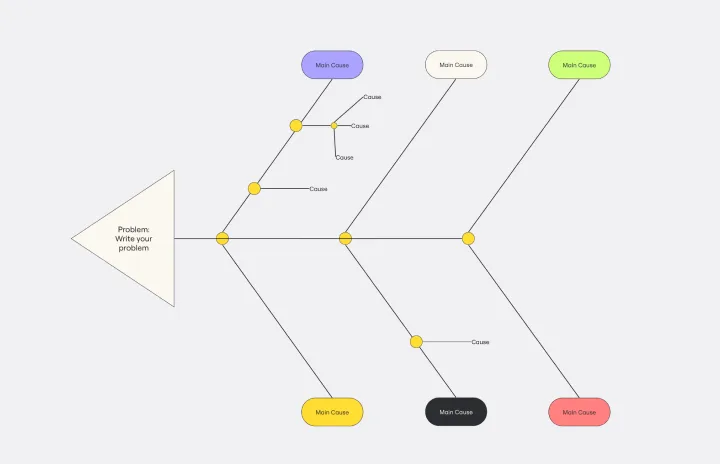
Cause and Effect Diagram Template
Works best for:
Diagramming
The Cause and Effect Diagram Template is a useful tool for analyzing complex relationships, identifying root causes of problems, and improving organizational processes. It can be customized to fit user's unique needs and provides a structured framework for analysis. Teams can use real-time collaborative analysis on the Miro platform to drive continuous improvement initiatives.
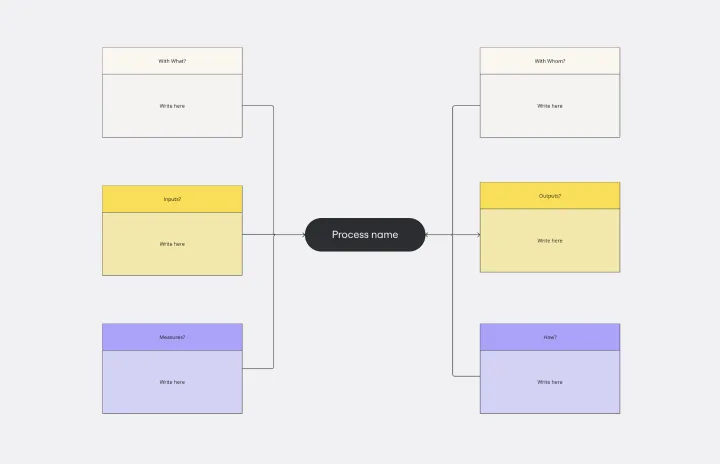
Turtle Diagram Template
Works best for:
Diagramming
The Turtle Diagram Template is an essential tool for capturing the essence of a process. It offers many benefits, but one stands out: it fosters clear and comprehensive communication within teams. By breaking down processes into digestible components, the template creates a common ground for discussion. It helps team members unfamiliar with certain processes or from different departments collaborate effectively by ensuring everyone's on the same page about the inputs, outputs, roles, resources, and procedures. This is crucial for organizations that aim to maintain coherence in quality management practices and drive collective efforts toward operational excellence.