Process Map Template
Analyze and document your team’s processes and outcomes with the process map template.
Trusted by 65M+ users and leading companies


About the Process Map Template
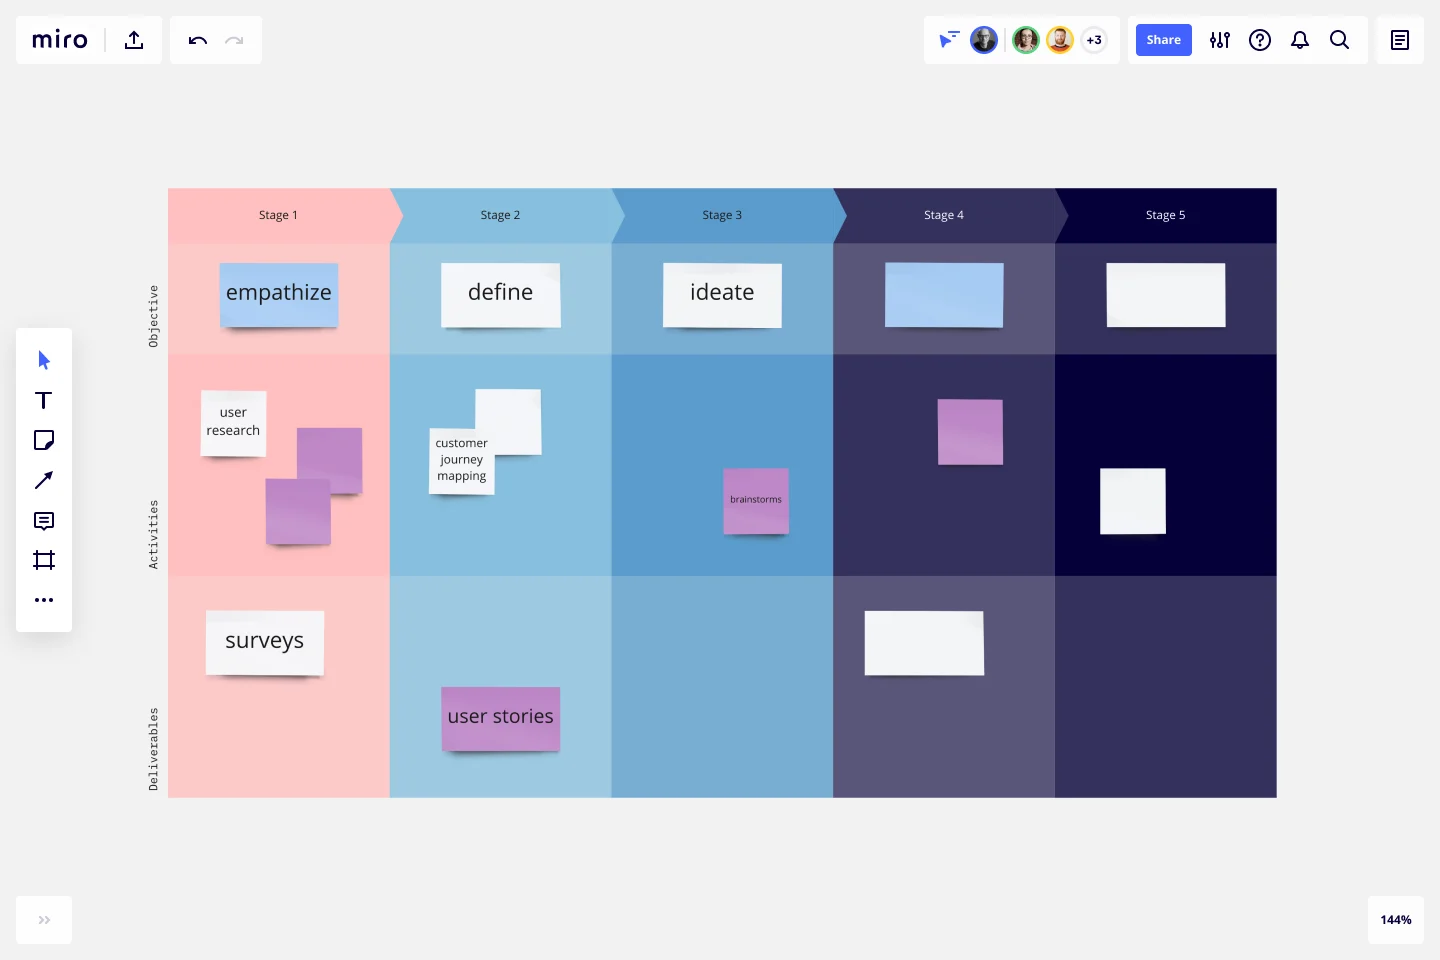
A process map template is valuable to document, analyze, and better understand your team’s business processes and associated outcomes. This process map template is organized by stages to help you record the objectives, activities, and deliverables during each step of a process. Use the template to improve your team’s organization, productivity, and communication by coming to a shared understanding of any kind of process.
What is the purpose of process mapping?
You would never think about setting out into the unknown without a map. A process map is no different. Process mapping is an effective exercise to assess, document, or strategize around any plan or approach your team might have. By breaking down the objectives, activities, and deliverables at any stage of a project, you can gain insight into whether you are on track or effectively working through a problem.
When to use the process mapping template
This process map template is set up to help teams increase efficiency. By seeing a process laid out on the page, teams can identify areas for improvement: how to streamline the process, improve communication, and create better documentation. Use process mapping tools when you need to assign stakeholders, define ownership and boundaries, clarify responsibilities, and establish metrics.
How to use the process map template
The goal of process mapping is to break down your project so that your teammates understand your objectives and how you plan to achieve them. By dividing the project into stages, you can avoid misunderstandings and ensure everyone is aligned before moving forward. Follow these steps to use the process map template:
Step 1: Define your goal
What is the problem you would like to solve? What’s the process you would like to visualize?
This is the time to think big. As you advance through your process map template, you’ll spend more and more time cutting your project up into bite-sized chunks. For now, though, feel free to set a broad goal.
Step 2: Brainstorm
What steps will you need to take to solve this problem? How will the process unfold?
Don’t get too bogged down in the order you must undertake the process. Focus on getting all the steps down on the board. Think about the stakeholders you will need to involve in this project. You can also brainstorm resources you’ll need to get the job done.
Step 3: Define success
How will you know when you’ve solved the problem? When is the process over?
Many teams skip this step, but it’s important not to neglect it. By defining clear metrics for success ― or even just a stopping point ― you give yourself something to work toward.
Step 4: Put things in order
What steps will you take to solve the problem? What is the order in which you must work to make sure the process gets done?
Now is the time to think linearly. Take all the raw material from your brainstorm and start putting things in order. If it’s too daunting to work linearly, start by defining what you’ll need to do first and last, and then work on everything in between.
Step 5: Draw it out
What does the problem look like? How can you visualize the process?
It’s time to put your process map template to work. Start by creating a key. The key should contain symbols that you’ll use throughout the process map.
You might need symbols representing activities, inputs, outputs, decisions, and endpoints. Use a system that is intuitive and scalable. For example, many people like to use arrows to indicate the flow of decision-making.
Step 6: Review the map
Are you in a good position to solve the problem? Does the process map look actionable and digestible?
Invite stakeholders to interrogate the map. Pay close attention to possible redundancies, bottlenecks, and problems with workflow. Go over each step to make sure they flow logically from one another. It might help to return to the documents from your brainstorm and make sure nothing was lost in translation.
What are the different types of process maps?
There are a few types of process maps that you can use: SIPOC map (Supplier, Input, Process, Output, and Customer), Deployment map, Swimlane map, and Value Stream Map. Each of these serves a different purpose for your organization and will produce additional insights into your business process mapping.
What are the three benefits of creating a process map?
When you have a process map template, you can quickly identify which stages in the process need automation and improvement. You can bring clarity to the current process status and communication between teams and departments.
What is a process map in project management?
The process map can help you visualize activities within any process. Project managers usually use it to know which steps are required to complete a project or workflow.
Get started with this template right now.
Retrospective
Works best for:
Retrospective, Agile Methodology, Meetings
The Retrospective template offers a versatile and adaptable framework for teams to reflect on their performance and processes. It provides elements for sharing feedback, identifying lessons learned, and brainstorming improvements. This template enables teams to foster open communication, identify opportunities for growth, and enhance collaboration. By promoting reflection and transparency, the Retrospective empowers teams to continuously learn and evolve, driving greater efficiency and effectiveness in their work.
Strategy Map Template
Works best for:
Leadership, Strategic Planning, Mapping
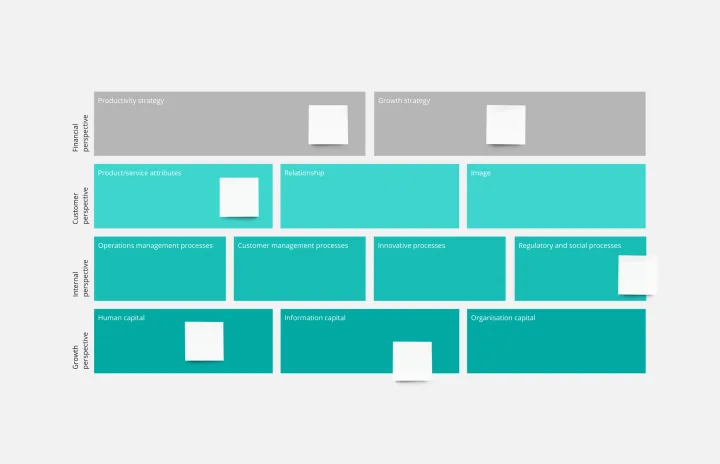
How do your individual or team goals relate to an organization’s overall strategy? A Strategy Map is a stylized picture of your organization’s strategy and objectives. It’s powerful because it provides a clear visual guide to how these various elements work together. Strategy Maps can help align various different team goals with the overall strategy and mission. With the Strategy Map in place, teams can create set actionable, relevant KPIs. Strategy mapping is often considered part of the balanced scorecard (BSC) methodology, which is a strategic planning tool for setting overall team goals.
What's on Your Radar Template
Works best for:
Business Management, Operations, Strategic Planning
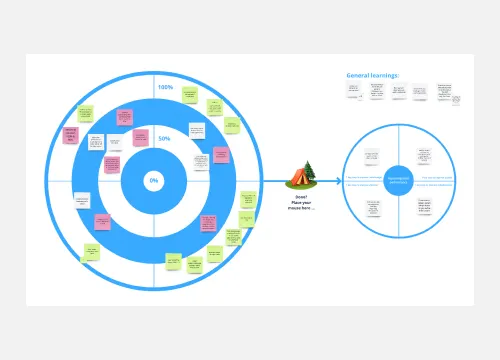
Do you or your team feel overburdened by tasks? Having trouble focusing on particular problems? What’s on Your Radar is a thought exercise in which you plot ideas according to their importance or relevance. Designers and teams use what’s on your radar to ensure that their ideas are within the scope of a given project. They also rely on the method to assess whether a given solution is likely to solve the problem at hand. But even if you’re not a designer, the method can help assign priorities and ground your ideas in reality.

Daily Stand-up Meeting Template
Works best for:
Agile Methodology, Meetings, Software Development
The entire team meets to review the day before and discuss the day ahead. These daily meetings, also known as “scrums,” are brief but powerful — they identify roadblocks, give each team member a voice, foster collaboration, keep progress on track, and ultimately keep teams working together effectively. This template makes it so easy for you to plan daily standups for your sprint team. It all starts with picking a date and time, creating an agenda, and sticking with the same format throughout the sprint.
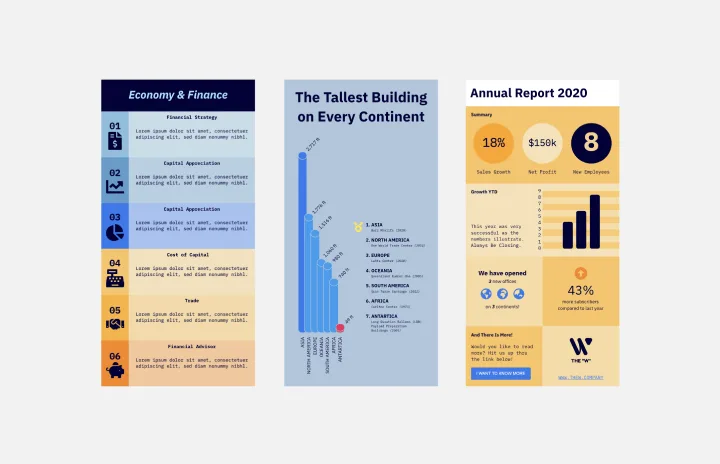
Infographic Template
Works best for:
Marketing, Desk Research, Documentation
As we bet you’ve experienced, data can get pretty dense and dry. But you need it to be compelling, memorable, and understandable. The solution? Infographics. These are tools that let you present information in a visually striking way and turn quantitative or qualitative data into stories that engage and resonate. Whoever you’ll be presenting to — customers, donors, or your own internal teams — our template will let you design an infographic that combines text and visuals to break down even the most complicated data.
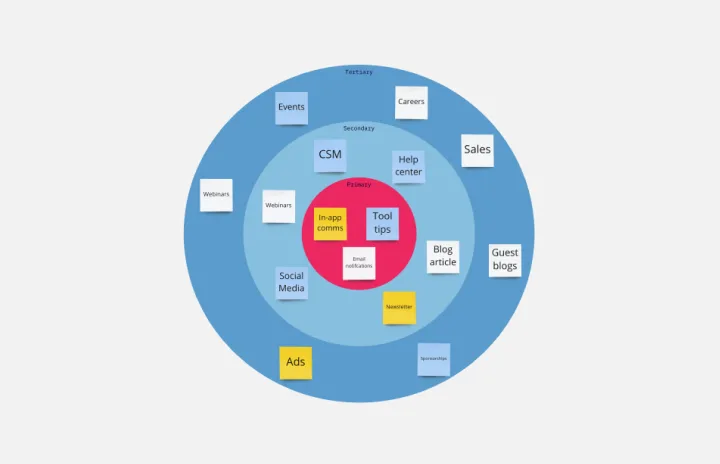
Bull's Eye Diagram Template
Works best for:
Diagrams, Project Management, Prioritization
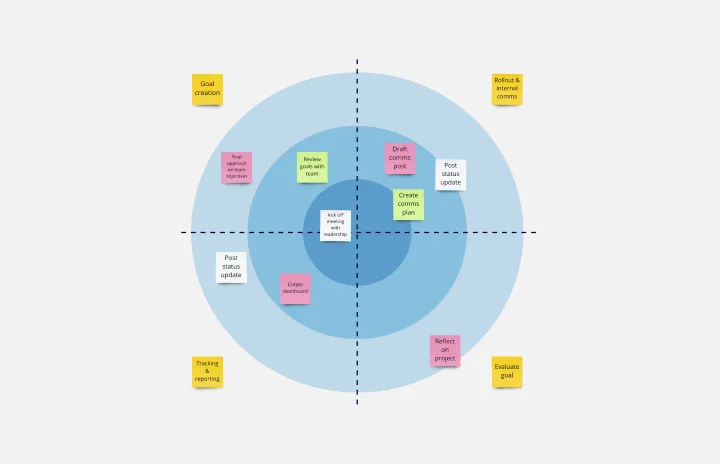
When you’re a growing organization, every decision can feel like it has make-or-break consequences—which can lead to decision paralysis, an inability to prioritize, inefficient meetings, and even low morale. If that sounds like you, put a Bull’s Eye Diagram to work. True to its name, a Bull’s Eye Diagram uses a model of concentric circles to help companies establish priorities, make critical decisions, or discuss how to remove or overcome obstacles.