UML Component Diagram Template
Plan, draw, and share an object-oriented system’s elements and components using our UML component diagram template.
Trusted by 65M+ users and leading companies


About the Component Diagram Template
Easily map out complex software systems using Miro’s fully customizable UML component diagram template. With pre-made component and interface symbols from our extensive UML shape pack, adjustable connection lines, and text boxes, you’re all set to create high-level visual overviews of anything from e-commerce systems to banking systems.
Using Miro’s component diagram template also gets you access to our powerful visual workspace — allowing you to quickly expand on the template with our automated diagramming tools and seamlessly collaborate with your team online.
We’ll walk you through how to make the most of our UML component diagram template.
How to use the component diagram template
To get started, click on the blue “Use template” button to open the component diagram template in Miro. Once you’re in, set your board up by inviting any collaborators you’d like to work on the template with. When you’re ready, follow the steps below to start filling the component diagram template out:
1. Pick a system
Decide on the system you’d like to visualize using the component diagram template — whether it’s an e-commerce system, banking system, or something else. It’s also worth aligning with your team to gather any input you might need from them to build the diagram.
2. Plot components
Once you’ve picked a system, start by visualizing its various components. The template comes with pre-made component symbols from our UML shape pack. To edit them, double-click on the pre-written text and add your own labels. For example, if you’re visualizing an e-commerce system, you might have components like “user interface,” “payment gateway,” and “product catalog.”
Need more components? Click on any component symbol to reveal blue dots on its side. Any blue dot you click on with automatically generate a connection line from that point with a matching component symbol on the other end — allowing you to quickly expand on the template.
3. Plot interfaces
The template also comes with pre-made interface symbols from our UML shape pack, with text boxes below each one. Double-click on the text boxes to replace the pre-written content with your own, allowing you to represent your system’s interfaces on the component diagram template. Going back to our e-commerce example, you might have interfaces labeled “customer interface” and “admin interface.”
4. Adjust connection lines
Use the template’s pre-made connection lines to visualize dependencies and wiring within your system. To adjust the lines, click on one to reveal two white dots on each end, and drag them until you’re happy with the position. You can use the blue dot in the middle to adjust your line’s curve.
You can also grab sticky notes or text boxes from the toolbar to give the connections some context. For example, you could add more information to the “payment gateway” component by adding a text box below it that says “handles payment processing and transactions.”
5. Customize the template
Now that you’ve visualized the key components, interfaces, and connections, it’s time to customize the component diagram template. Change colors, play with font types, and adjust the sizes of your elements — anything that might make your diagram easier to understand, or simply make it your own.
You could even change the styles of your connection lines for some visual differentiation between them. Just click on a connection line to reveal the pop-up menu, then click on “Type” to edit your line style.
6. Share the diagram
Get feedback on your completed component diagram template by inviting your team to view and comment on your Miro board. You can also export it as a PDF or image, generate a shareable link, or embed your Miro board on other sites.
Prefer to build your component diagram from scratch? Use Miro's UML component diagram tool and get access to our extensive UML shape pack.
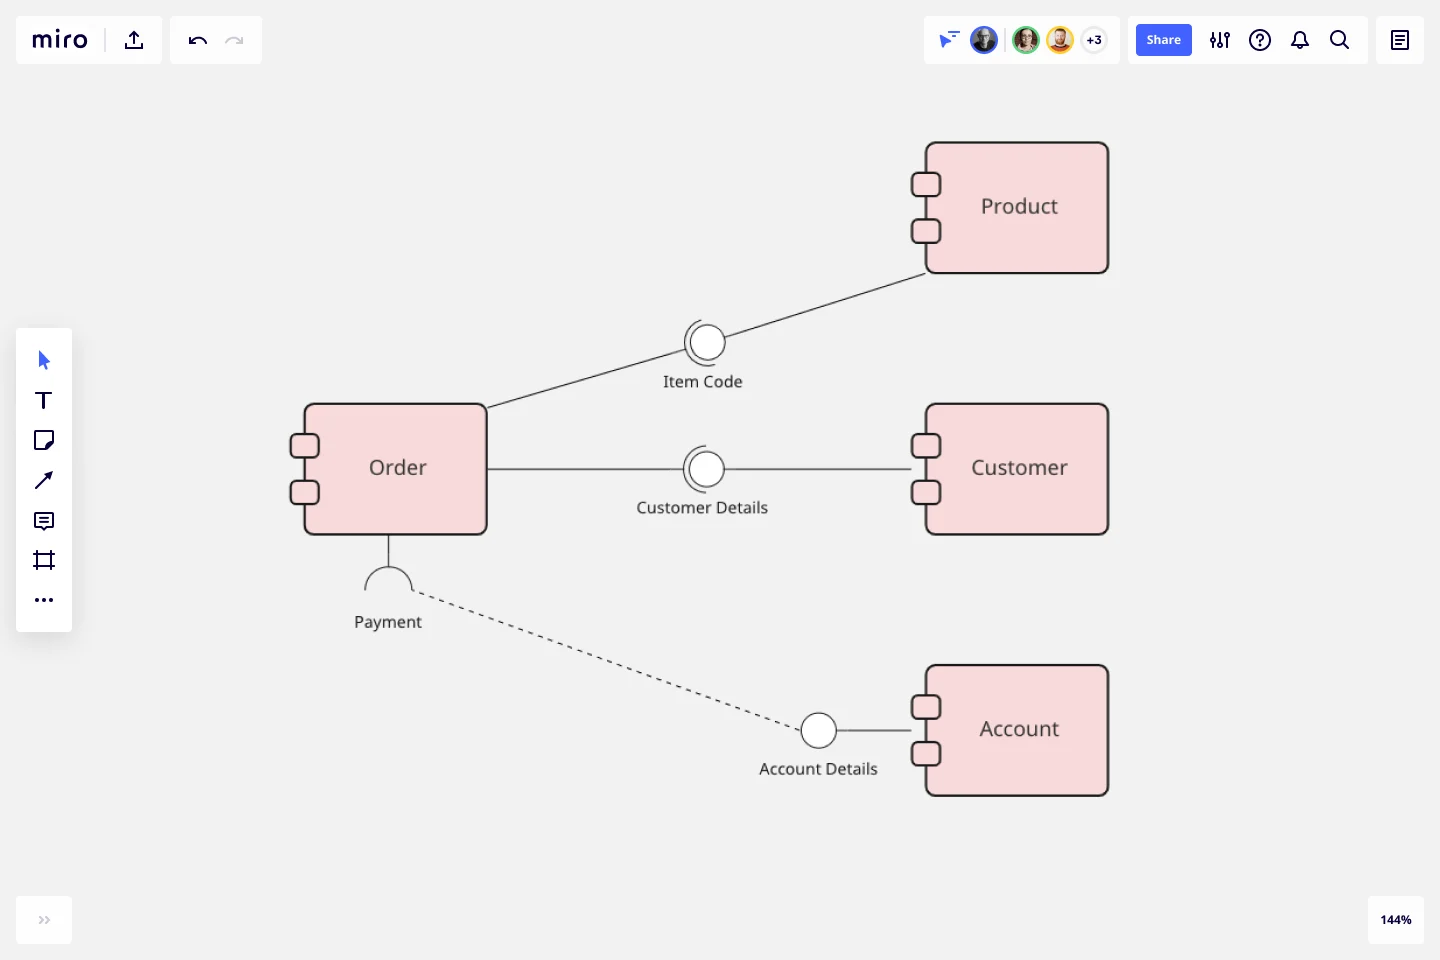
Component diagram example: e-commerce website
Let’s take a look at an example of a component diagram depicting an e-commerce website. In this case, you’d make sure the component diagram template illustrates all the physical components and artifacts that make up an e-commerce system. Here are some components you’d include:
Suppliers
Components labeled “suppliers” might refer to warehouses that stock and re-sell goods or fulfill physical orders. It could also include production facilities, like factories and workshops. Supplier components typically connect to transportation, logistics, manufacturing, and other adjacent components.
Goods
Physical goods are another common component of a diagram representing an e-commerce website. You could visualize them independently of other components, or visualize them as part of a factory, a store, or a warehouse.
The receiving customer
Since the receiving customer is a physical entity too, it’s worth representing them on the component diagram template. Though you’d likely separate them from the rest of your components since they only interact with the system and aren’t actually part of it.
When should I use a UML component diagram?
A UML component diagram shows the components and artifacts in a system and the structural relationship between these components and artifacts. You can use component diagrams to plan, create, and optimize system components at a high level — in software development, business process planning, and other complex processes across digital and business.
Can I collaborate with others on the UML component diagram template?
Yes, Miro brings teams together — whether you’re working remotely or in person. Invite your team to edit your Miro board with you in real-time or async — or get instant feedback by inviting them to view and comment on the component diagram template. You can also run live and interactive presentations right from your Miro board using Use Presentation Mode, or use TalkTrack to record immersive audio and video walkthroughs your team can watch in their own time.
Does Miro offer a shape pack for UML diagramming?
Yes, Miro offers plenty of specialized shape packs, including a UML shape pack — allowing you to fill out the component diagram template with industry-standard symbols. Get access to our UML shape pack with a Business, Enterprise, or Education plan.
Get started with this template right now.
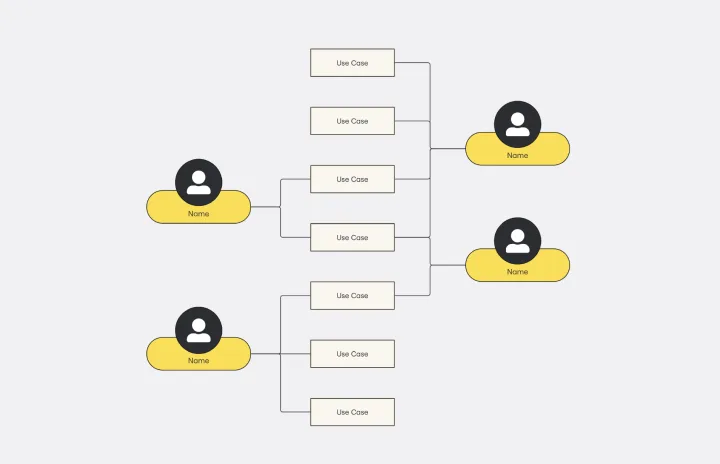
Use Case Diagram Template
Works best for:
Marketing, Market Research, Diagrams
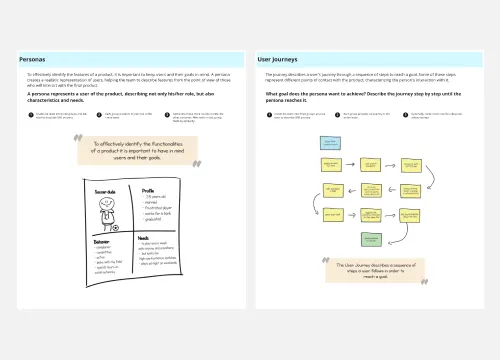
A use case diagram is a visual tool that helps you analyze the relationships between personas and use cases. Use case diagrams typically depict the expected behavior of the system: what will happen and when. A use case diagram is helpful because it allows you to design a system from the perspective of the end user. It’s a valuable tool for communicating your desired system behavior in the language of the user, by specifying all externally visible system behavior.
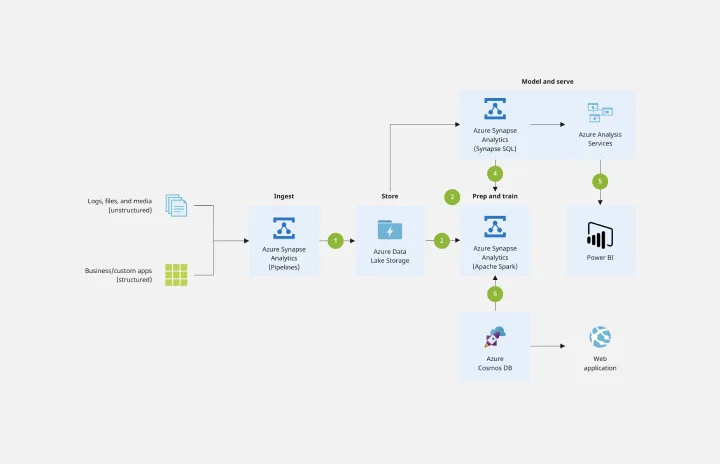
Azure Data Flow Template
Works best for:
Software Development, Diagrams
The Azure Data Flow is a diagram that will allow you to combine data and build and deploy custom machine learning models at scale. Azure is Microsoft’s cloud computing platform, designed to provide many cloud-based services like remote storage, database hosting, and centralized account management. Azure also offers new capabilities like AI and the Internet of Things (IoT).
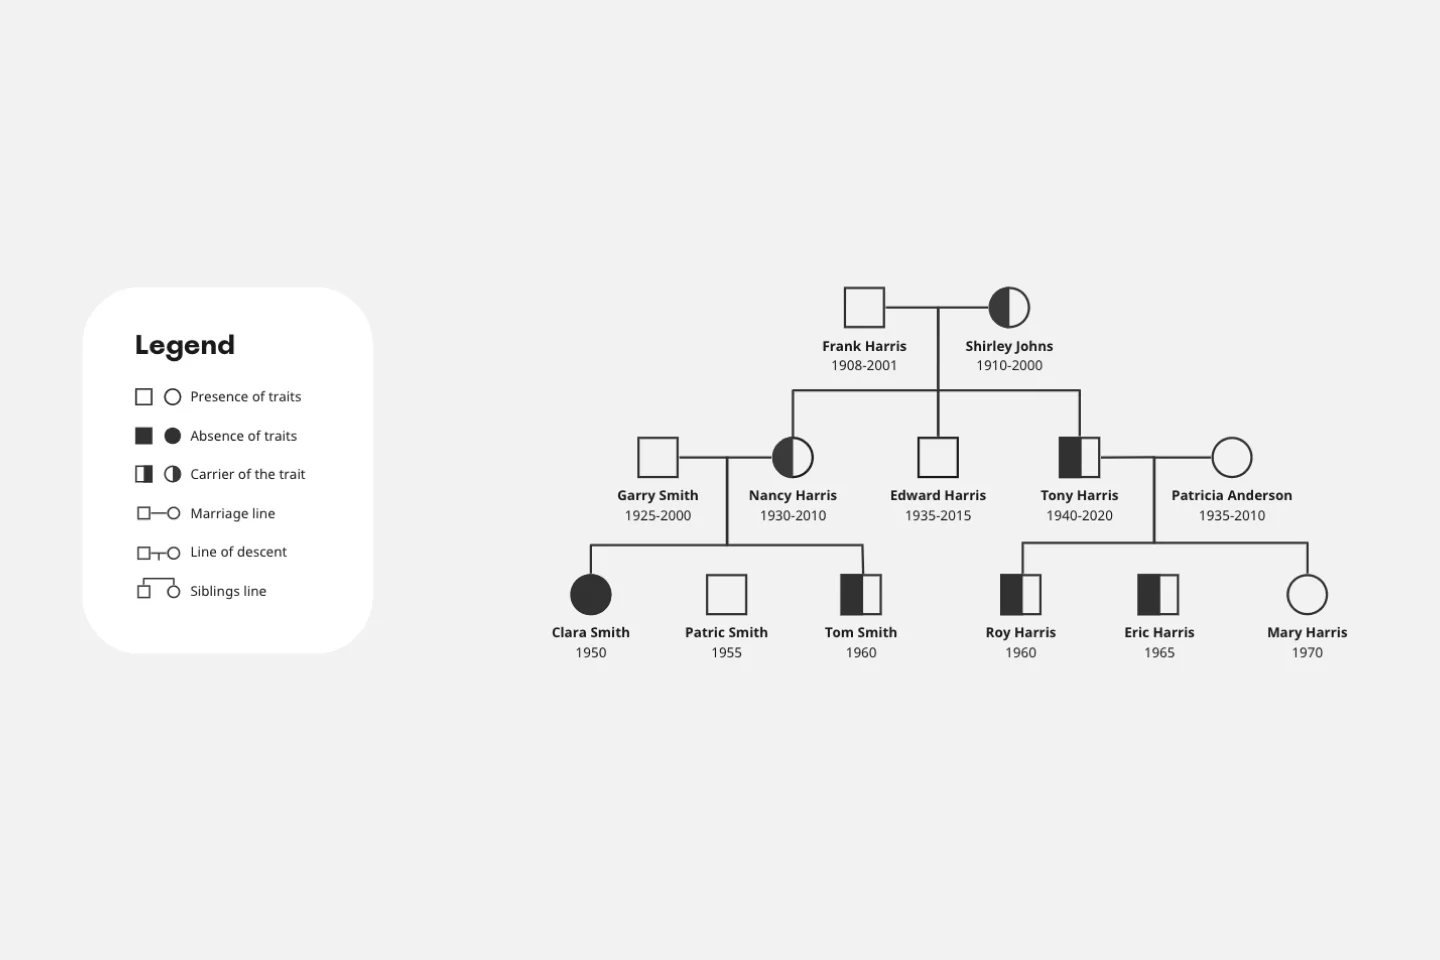
Pedigree Diagram Template
Works best for:
Education
Use our Pedigree Diagram Template to show how traits and diseases are passed from one generation to the next. Whether you’re a doctor, farmer, or just someone interested in genetics, a Pedigree Diagram can help you identify hereditary traits.
Lean Inception Workshop
Works best for:
Agile, Lean Methodology
The Lean Inception Workshop streamlines project kickoff by aligning teams on goals, scope, and priorities. It leverages Lean principles to eliminate waste and maximize value, guiding exercises to define user personas, map user journeys, and prioritize features. By fostering cross-functional collaboration and customer-centric thinking, this template accelerates project initiation and ensures alignment between stakeholders, empowering teams to deliver customer value faster.
Kaizen Report Template
Works best for:
Agile Methodology, Operations, Documentation
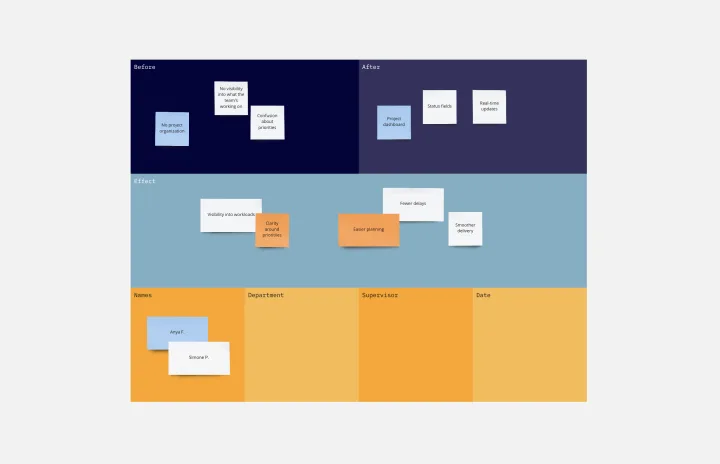
What makes a great company great? They know that greatness needs to be fostered and maintained — meaning they never stop working to improve. If you’re one of those companies (or aspire to be), a kaizen report is an ideal tool. It creates a simple visual guide to continuous improvement activities on a team, departmental, and organizational level. Using a kaizen report approach, every employee in an organization audits their own processes and understands what they might have overlooked, making this a powerful tool for increasing accountability at all levels.
Inverted Org Chart Template
Works best for:
Org Charts, Organizational Design
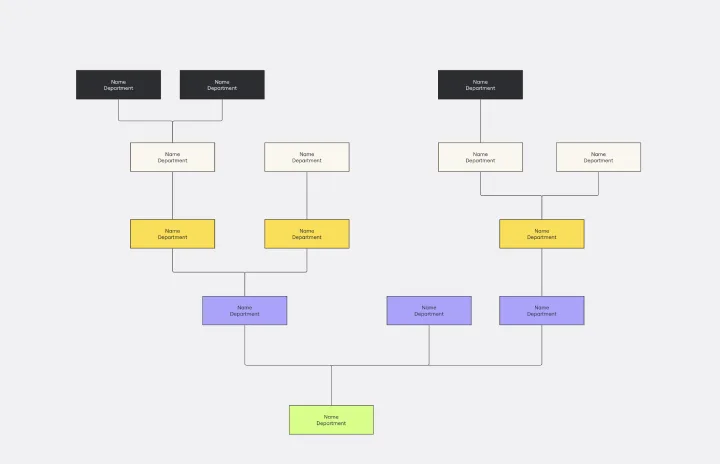
The Inverted Org Chart Template is a tool that reimagines the traditional hierarchical model by placing frontline employees at the top of the organizational structure. This innovative approach highlights the crucial role played by those who interact with customers directly, ensuring that their insights and contributions are not only recognized but also celebrated. One of the key advantages of this template is that it fosters a feedback-driven environment. Prioritizing frontline workers promotes a culture where valuable insights from the ground can quickly reach the top of the hierarchy, streamlining decision-making processes and ensuring that strategies are based on real-world experiences.