Kubernetes Architecture Diagram Template
Visualize the deployment of your applications with Kubernetes Architecture Diagram template and optimize your processes.
Trusted by 65M+ users and leading companies


About the Kubernetes Architecture Diagram Template
A Kubernetes Architecture Diagram template is where you can visually represent the deployment, scale, and management of containerized applications. You can use a Kubernetes Architecture Diagram template to manage apps and ensure there is no downtime in production.
This Kubernetes Architecture Diagram for K8 architecture helps you and your team manage the deployment of applications. This template can be used to organize applications and easily map out Kubernetes decentralized architecture.
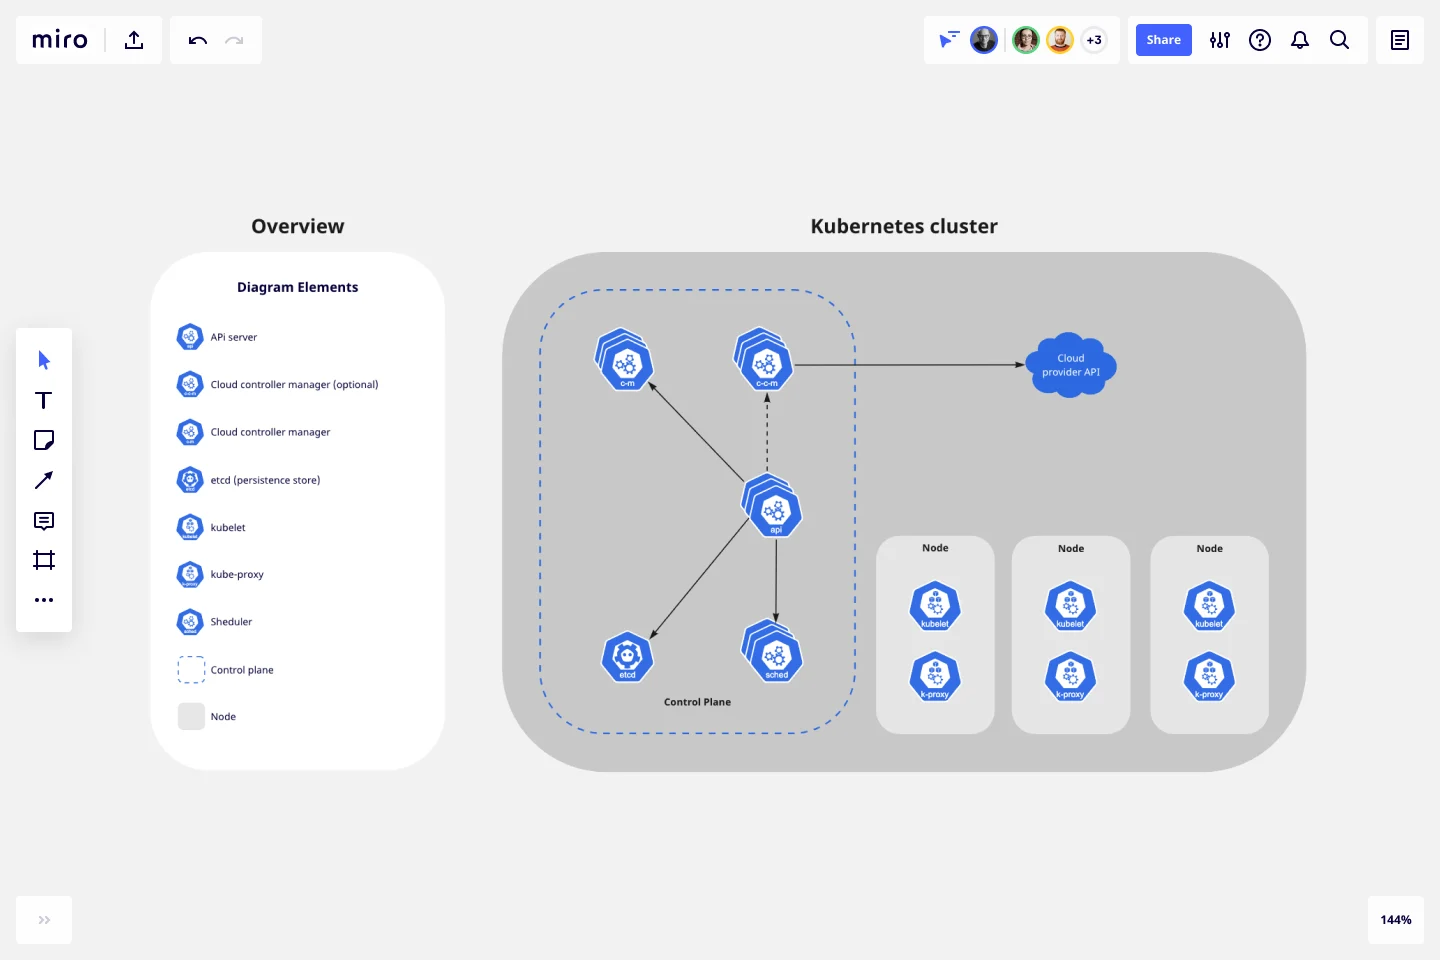
Kubernetes cluster architecture and components
When you deploy Kubernetes, you get a cluster which is a node that runs containerized applications.
Developers use containers because they provide extra benefits such as agile app creation, deployment, and continuous development and integration. Containers are coordinated automatically and monitored constantly, and the K8s architecture makes it easy to deploy and scale containerized applications.
The components of a Kubernetes Architecture Diagram template are:
Cloud controller manager: links your cluster to the cloud provider
Controller manager: makes global decisions about the cluster
Etcd (persistent store): backs store for all cluster data
Kubelet: runs each node in the cluster
Kube proxy: network proxy that runs in each node of the cluster
Scheduler: watches for newly created Pods with no assigned node, and selects a node for them to run on
Control place: runs controller processes
Node: provides Kubernetes runtime environment
How do I create a Kubernetes Architecture Diagram template?
A Kubernetes Architecture Diagram template allows you to visualize the deployment of apps.
To create a basic Kubernetes diagram with Miro, you can follow these steps:
Define your Kubernetes Architecture cluster.
List your Kubernetes components, using our set of Kubernetes Icons.
Organize your diagram, adding the components.
Add connection lines between the component shapes and set the arrows in the direction of the flow.
Format and customize your Kubernetes Architecture Diagram template.
In Miro, you can quickly build a Kubernetes Diagram from scratch using our design tools and icons set, or use our Kubernetes Architecture Diagram template and customize it as you see fit.
If you are interested in creating other network diagrams, Miro is the perfect network diagram tool with several available shape packs and templates to suit your needs.
How to create a Kubernetes diagram using this template?
In Miro you can create a Kubernetes Architecture Diagram using our template from our Templates Library or build your own diagram from scratch. Add Kubernetes icons by selecting our icons set on the left sidebar, connecting them with connector lines, and placing arrows in the flow direction. Miro’s collaborative whiteboard allows you to work together in real-time or asynchronously. Try it for yourself to see how it can work for you.
Why is it important to diagram Kubernetes architecture?
Developers create a Kubernetes Architecture Diagram to better manage and deploy application containers and continuously improve development, integration, and app deployment. Having a Kubernetes diagram helps to work across teams and to keep collaboration seamlessly when managing applications.
Get started with this template right now.
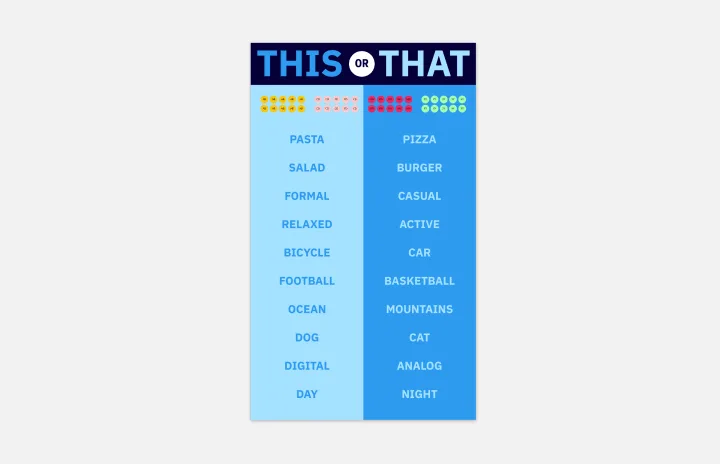
This or That Template
Works best for:
Marketing, Meetings, Workshops
If you’re a social media manager, a designer, or just someone who loves photography, then you’ve probably seen the “This or That” game on Instagram. The premise is simple: You make two parallel lists that pit a series of choices against each other, like “apples or oranges” or “pizza or hot dogs”. The Instagram user chooses between the various options by circling the one that they prefer. Then they share the completed game with their followers. Although it was popularized on Instagram, you can use This or That on other social media platforms too, or even your website or blog.
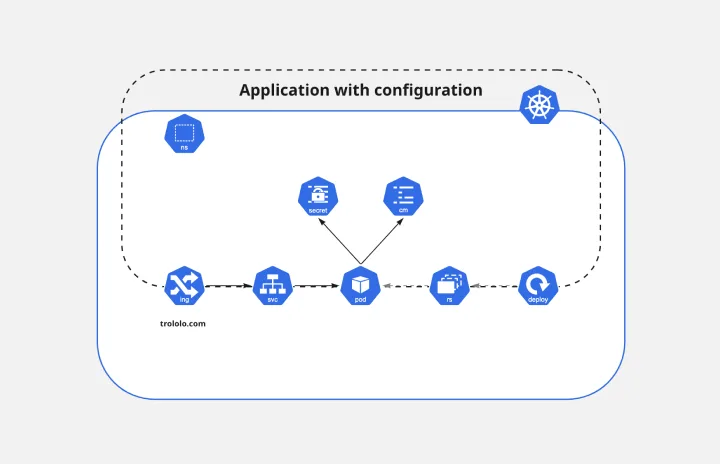
Kubernetes Application Template
Works best for:
Software Development, Diagrams
Use the Kubernetes Application template to manage enterprise-ready containerized applications better. You can now get your team more agile when dealing with portability, licensing, and consolidated billing. The Kubernetes Application template allows you to run deployments anywhere, facilitating the management of your applications. Try it out and see if it’s the best fit for you and your team.
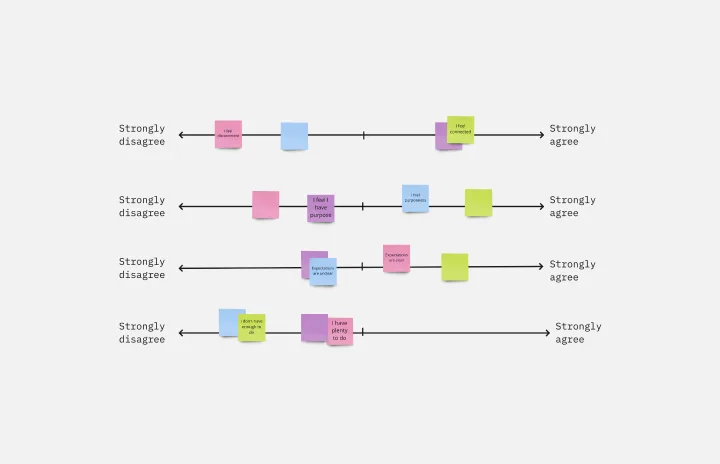
Likert Scale Template
Works best for:
Desk Research, Decision Making, Product Management
It’s not always easy to measure complex, highly subjective data — like how people feel about your product, service, or experience. But the Likert scale is designed to help you do it. This scale allows your existing or potential customers to respond to a statement or question with a range of phrases or numbers (e.g., from “strongly agree” to “neutral,” to “strongly disagree,” or from 1 to 5). The goal is to ask your customer some specific questions to turn into easy-to-interpret actionable user insights.
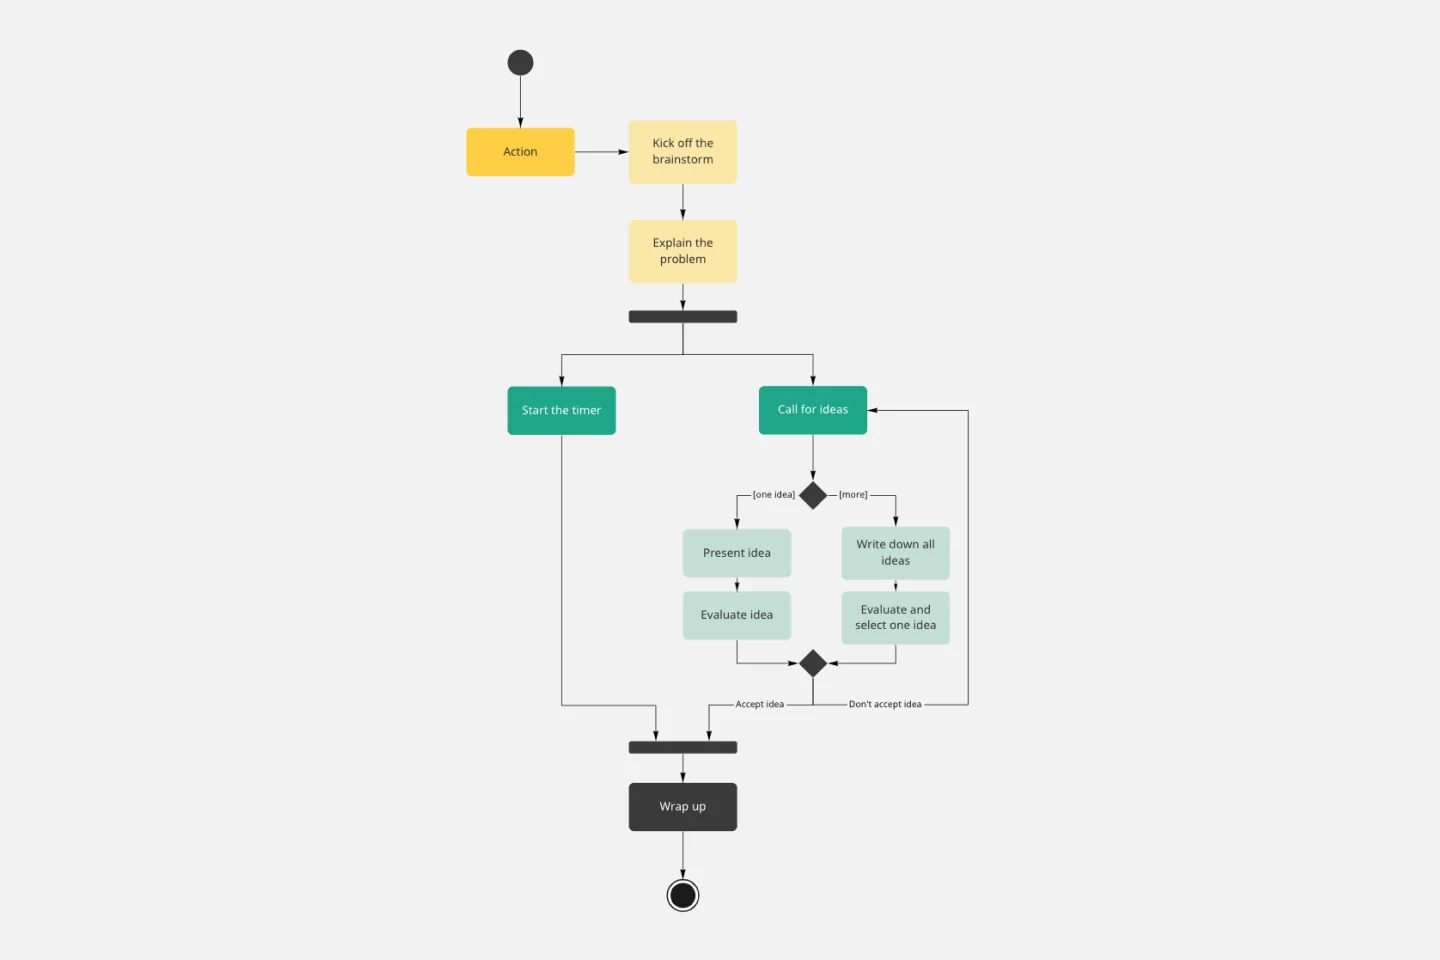
UML Activity Diagram Template
Works best for:
Diagrams
Use our Activity Diagram template to break down activities into smaller decisions and subprocesses. Improve and optimize systems and processes in I.T., business management, and more.
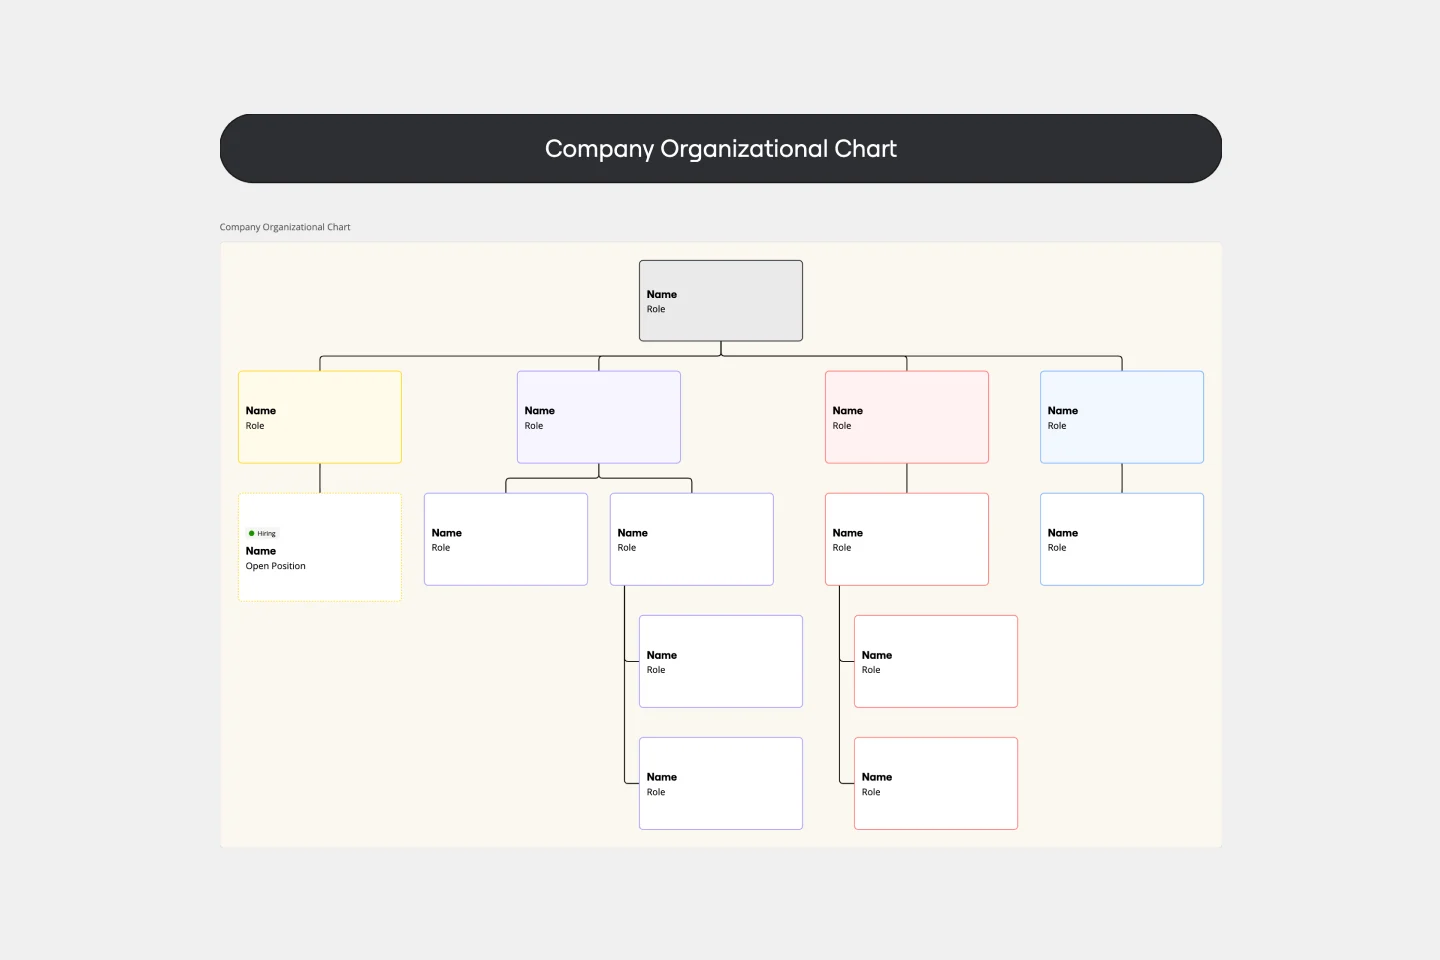
Company Organizational Chart
Works best for:
Org Charts, Operations, Mapping
An org chart is a visual guide that sums up a company’s structure at a glance—who reports to whom and who manages what teams. But it does more than just display the chain of command. It also showcases the structure of different departments and informs employees who to reach out to with issues and concerns. That makes it an especially valuable tool for new hires who are getting familiar with the company. Our templates make it easy for you to add your entire team and customize the chart with colors and shapes.
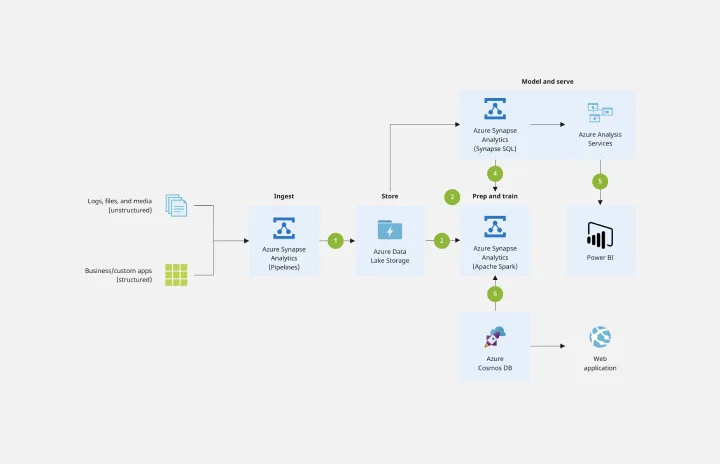
Azure Data Flow Template
Works best for:
Software Development, Diagrams
The Azure Data Flow is a diagram that will allow you to combine data and build and deploy custom machine learning models at scale. Azure is Microsoft’s cloud computing platform, designed to provide many cloud-based services like remote storage, database hosting, and centralized account management. Azure also offers new capabilities like AI and the Internet of Things (IoT).