Design Research Template
Use a Design Research Template to predict links between industry trends to make better business decisions.
Trusted by 65M+ users and leading companies


About the Design Research template
A design research map can be an integral tool in helping your team connect and see the collective value of seemingly unrelated practices.
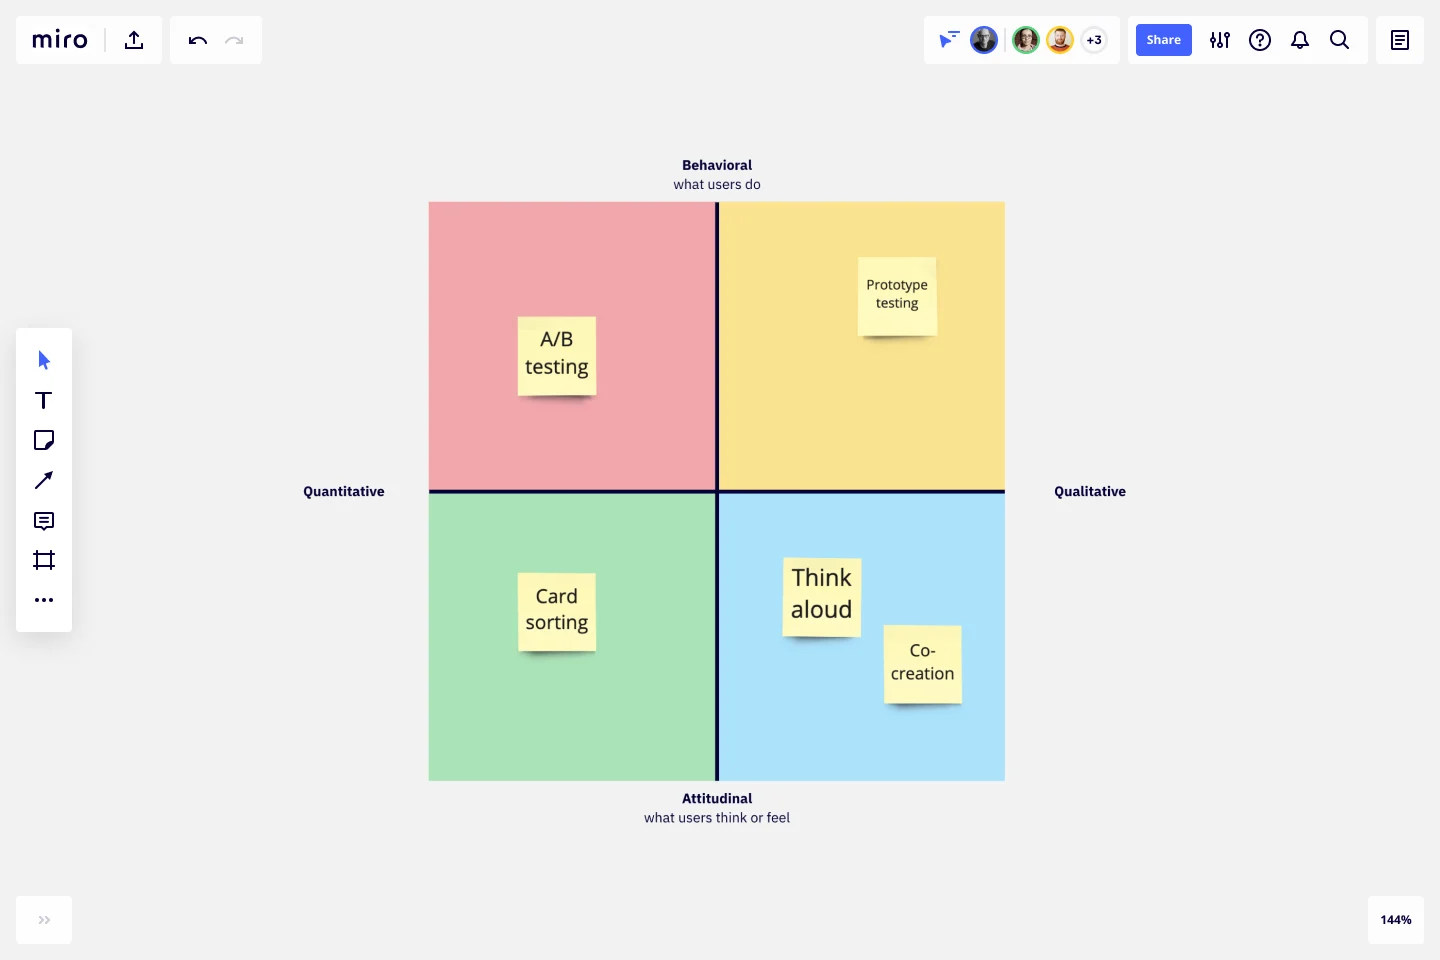
Miro's design research template is a grid framework showing the relationship between two key intersections in research methodologies: mindset and approach.
The map typically has four quadrants:
Behavioral: What users do, how they behave, and why they behave in certain ways.
Attitudinal: What users think and why they feel a certain way.
Quantitative: The numbers-based data that informs our understanding of user behavior and attitudes.
Qualitative: Descriptive and interpretation-based data to inform our understanding of user behavior and attitudes.
The information in these quadrants allows us to review distinct or overlapping methodologies:
To be design-led means that either critical or generative trends are driving the designers or researchers involved. You can either design for or with people.
To be research-led means applying methods historically used by psychologists, anthropologists, sociologists, and engineers.
Designing or researching with a participatory mindset means researchers and designers value users as co-creators in the design process. Practitioners can use findings to shape products or services to meet customer needs.
Designing or researching with an expert mindset means viewing researchers or designers as experts that are designing for users and consumers.
A mapping approach helps both user experience designers and clients understand the current state. It also predicts how tools, methods, and trends will likely shift in the future.
What is design research?
Whether your team is in problem-solving or problem definition mode, design research helps you consider the collective value of typically unrelated practices. It forces teams to look at multiple disciplines from a new perspective, helping them think outside the box to find new ways to improve.
It reminds your internal team (and external stakeholders) that you can veer away from tunnel-visioning toward another way of doing things. For example, you might be able to align design thinking with methods from other industries to drive the potential for innovation and change. Without the design research approach, you might never have considered this an option.
How to use the design research template
Making your own design research maps is easy. Miro’s template makes it easy to get started on the design mapping process, allowing you to collaborate with your team every step of the way. Start by selecting this template, then take the following steps to make one of your own.
1. Collect your data
Start by collecting the data you need to make the most out of your design research template. The data you need will depend on what you want to learn from the process. Do you want to improve the customer experience? Launch a new product? Increase revenue? Identify your goal and start your research to collect relevant data. You’ll also need to figure out which type of data you need. Will you use primary, secondary, or evaluative data?
2. Add new grid content if you offer a new research method
If your team (or client) offers a new design research methodology, encourage them to find a place for it on the map. This can kick-start discussions about the best-fit mindset and approaches for your business. Miro allows you to turn sketches into shapes or sticky notes as needed.
3. Edit label text to reflect the industry context you want to present
If you want to represent a different perspective, you can change labels accordingly. Delete or add new methods, edit axis labels, and resize individual bubbles representing changes in overlap or cultural dominance.
4. Research and add new methods or trends as you learn more
Design research is a constantly evolving process. As you learn more, experiment with adding, removing, or shifting methods you find, test, or are recommended.
When to use design research mapping
Design research maps help teams gain a better understanding and awareness of factors driving the adoption of certain methodologies or trends.
Try using the map as an educational tool to help your team or clients understand design concepts or problem-solving techniques. That way, you won’t have to rely on the presence of academics or industry veterans in meetings.
As a design practitioner, you can also use design research maps to:
Write up design or research proposals or project plans. You can use a design map to back up your points and explore new ideas in detail.
Explain why you need to use different research methods. Use your design research map to show people why you’re suggesting new methods and how you expect them to pan out. Without the evidence, it’s unlikely any of your clients or internal cross-functional teams will jump on board.
Understand the competitive landscape. The future of design research is constantly changing. Amidst developing methods and new trends, it’s important to stay ahead of the curve. To make sure you differentiate yourself from your competitors, use the design map to identify gaps in the market and areas for competitive improvement.
Understand the historical context. A design research map allows you to understand the history of design or research tools, methods, and ideas of interest to you. This can develop your understanding and help you make informed decisions.
Create a long-term vision. As trends shift, you need to keep on top of your strategy. Using the design map allows you to think about the long term and make strategic yet innovative business decisions.
Translate data into actionable outcomes. Using all the data you put into the design research map, you can create actionable tasks that will help your business succeed.
Ideally, this map should be treated as a living document to spark forward-thinking action and support conversations between different departments and stakeholders.
What are the 5 types of research design?
There are five main types of design research methods (sometimes they’re known as design research categories):
Descriptive research. Collecting data, analyzing it, and presenting it in an understandable way. This method is theory-based and is the most generalized form of research.
Correlational research. Looking at the relationship between two variables without any involvement from the researcher.
Experimental research. Establishing a cause and effect, experimental research takes a scientific approach with two sets of variables.
Diagnostic research. Researching the underlying cause for a particular condition. It helps teams better understand how and why a process works in a certain way.
Explanatory research. Using the researchers' thoughts and ideas to explore their theories in more detail.
How do you describe design research?
Design research is research conducted to inform how to approach a design problem. It enables the integration of different elements to find a solution or improvement in a logical way. It helps teams think outside the box to find new and innovative ways to improve processes, UX, and product design and generally boost business growth.
Get started with this template right now.
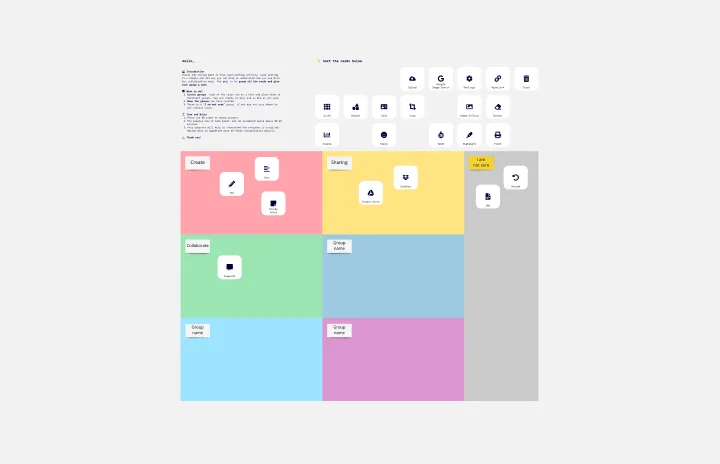
Card Sorting Template
Works best for:
Desk Research, UX Design, Brainstorming
Card sorting is a brainstorming technique typically used by design teams but applicable to any brainstorm or team. The method is designed to facilitate more efficient and creative brainstorms. In a card sorting exercise, you and your team create groups out of content, objects, or ideas. You begin by labeling a deck of cards with information related to the topic of the brainstorm. Working as a group or individuals, you then sort the cards in a way that makes sense to you, then label each group with a short description. Card sorting allows you to form unexpected but meaningful connections between ideas.

Annual Calendar Template
Works best for:
Business Management, Strategic Planning, Project Planning
Plenty of calendars help you focus on the day-to-day deadlines. With this one, it’s all about the big picture. Borrowing from the grid structure of 12-month wall calendars, this template shows you your projects, commitments, and goals one full year at a time. So you and your team can prepare to hunker down during busy periods, move things around as needed, and celebrate your progress. And getting started is so easy—just name your calendar’s color-coded streams and drag stickies onto the start date.
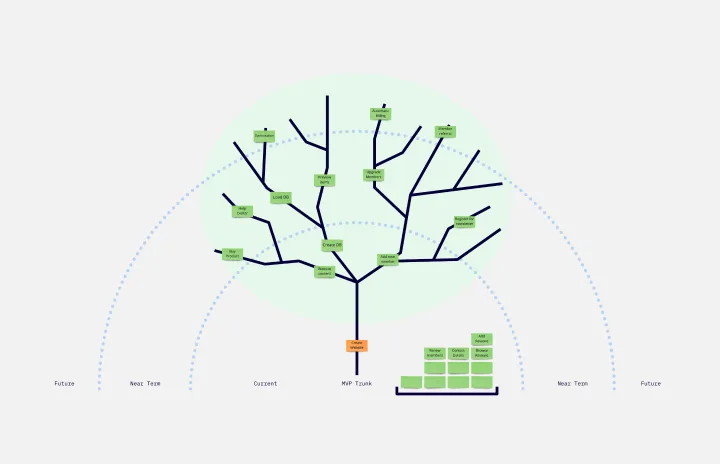
Prune the Product Tree Template
Works best for:
Design, Desk Research, Product Management
Prune the Product Tree (also known as the product tree game or the product tree prioritization framework) is a visual tool that helps product managers organize and prioritize product feature requests. The tree represents a product roadmap and helps your team think about how to grow and shape your product or service by gamifying feedback-gathering from customers and stakeholders. A typical product tree has four symbolic features: the trunk, which represents the existing product features your team is building; the branches, each of which represents a product or system function; roots, which are technical requirements or infrastructure; and leaves, which are new ideas for product features.
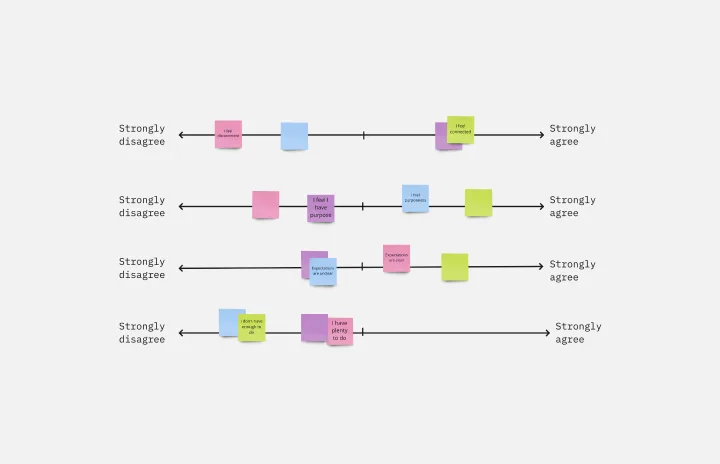
Likert Scale Template
Works best for:
Desk Research, Decision Making, Product Management
It’s not always easy to measure complex, highly subjective data — like how people feel about your product, service, or experience. But the Likert scale is designed to help you do it. This scale allows your existing or potential customers to respond to a statement or question with a range of phrases or numbers (e.g., from “strongly agree” to “neutral,” to “strongly disagree,” or from 1 to 5). The goal is to ask your customer some specific questions to turn into easy-to-interpret actionable user insights.
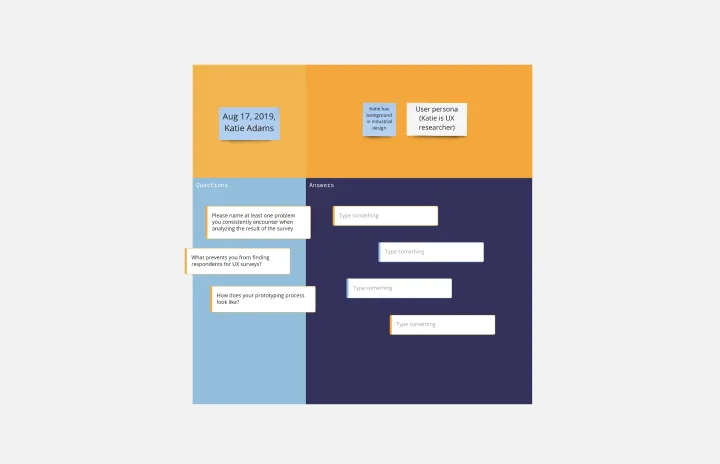
User Interview Template
Works best for:
Desk Research, Product Management
A user interview is a UX research technique in which researchers ask the user questions about a topic. They allow your team to quickly and easily collect user data and learn more about your users. In general, organizations conduct user interviews to gather background data, to understand how people use technology, to take a snapshot of how users interact with a product, to understand user objectives and motivations, and to find users’ pain points. Use this template to record notes during an interview to ensure you’re gathering the data you need to create personas.
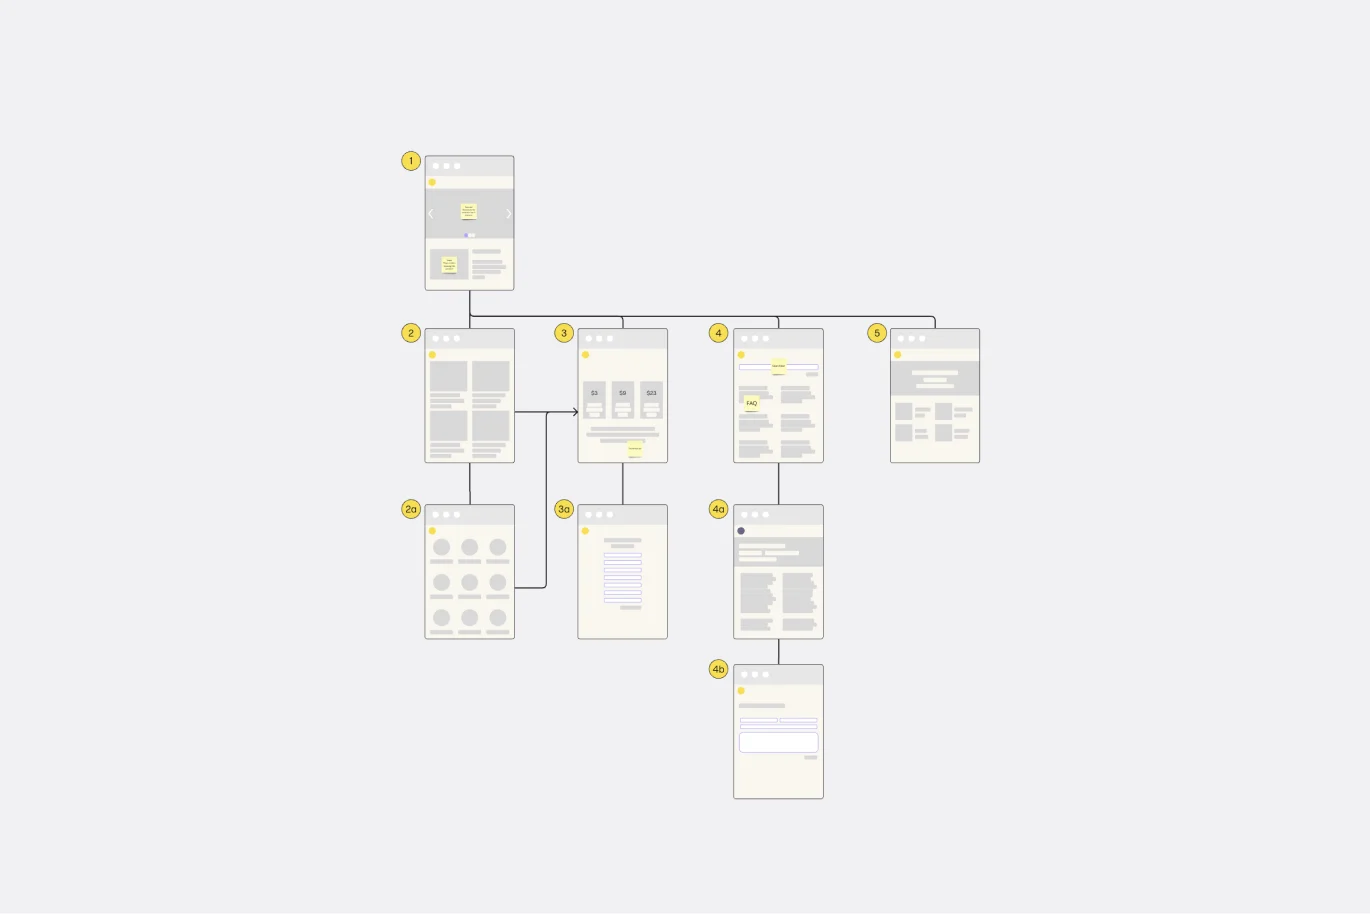
Website Flowchart Template
Works best for:
Flowcharts, Mapping, User Experience
A website flowchart, also known as a sitemap, maps out the structure and complexity of any current or future website. The flowchart can also help your team identify knowledge gaps for future content. When you’re building a website, you want to ensure that each piece of content gives users accurate research results based on keywords associated with your web content. Product, UX, and content teams can use flowcharts or sitemaps to understand everything contained in a website, and plan to add or restructure content to improve a website’s user experience.