4-Circle Venn Diagram Template
Use the 4-Circle Venn Diagram Template to visualize complex relationships between data sets. Empower your team's collaboration and communication with this powerful tool today.
Trusted by 65M+ users and leading companies


About the 4-Circle Venn Diagram Template
The 4-Circle Venn Diagram Template is a powerful visual tool to help you effectively map out and explore different aspects of your concepts, ideas, or problems. Simplify complex information, create clear intersections, and foster better understanding by creating a 4-Circle Venn diagram. Whether you are brainstorming, analyzing data, or seeking overlaps between multiple elements, our 4-Circle Venn Diagram Template has got you covered.
What's a 4-Circle Venn Diagram Template?
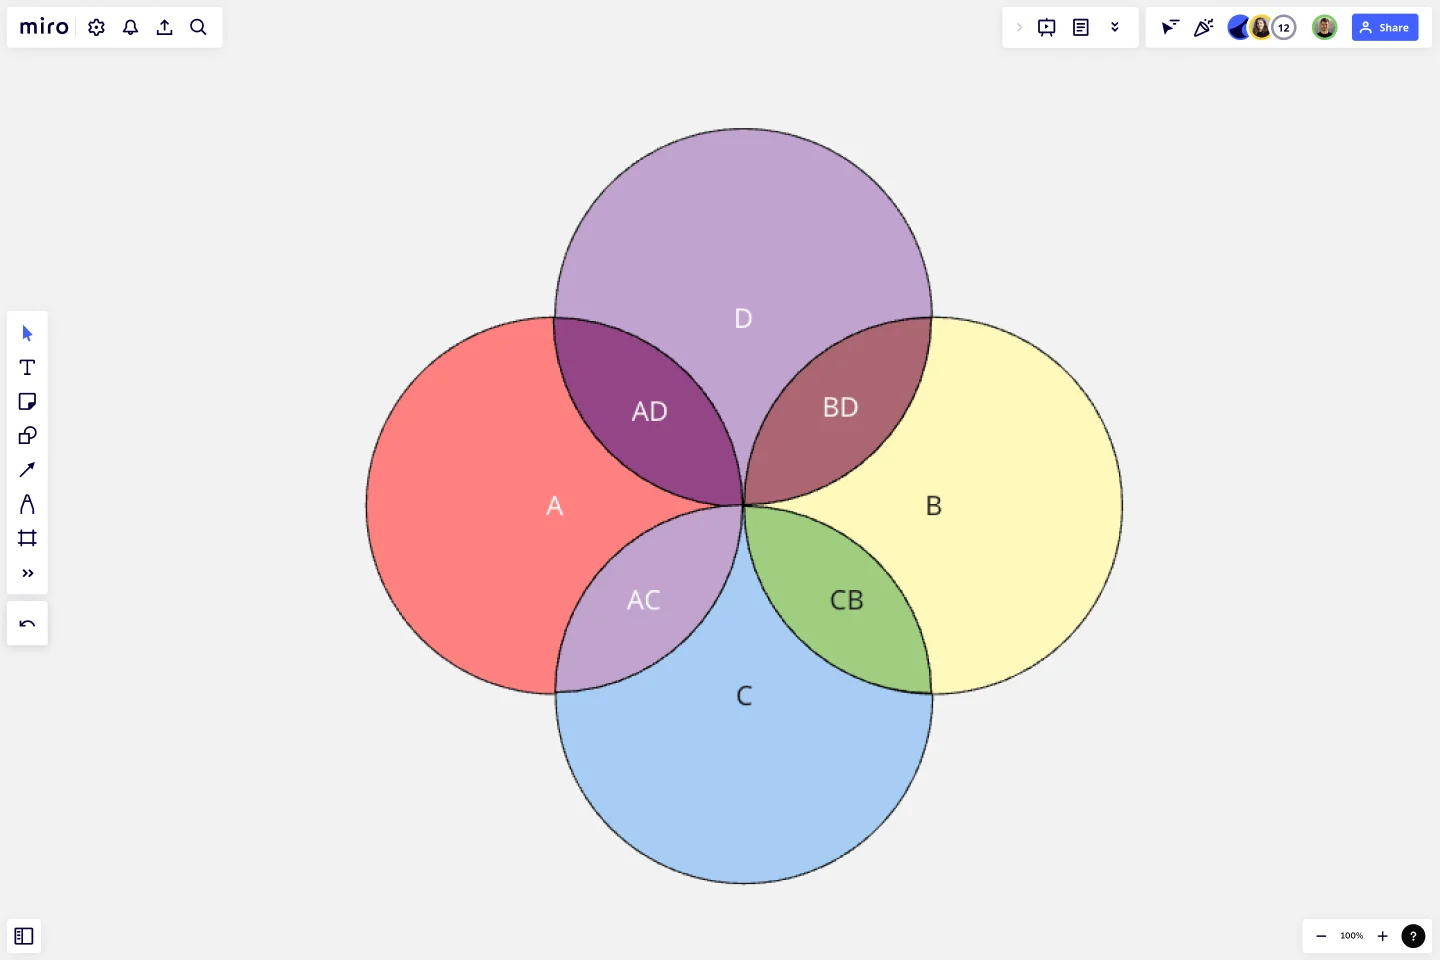
A 4-Circle Venn Diagram Template is a visual representation showcasing the relationships between four different data sets. Each circle in the diagram represents a unique set, and the areas where they intersect signify commonalities. This dynamic tool allows for easy comparison and contrast of information, making it a powerful aid in decision-making processes, problem-solving, data visualization, and more.
How to use a 4-Circle Venn Diagram Template in Miro
Step 1: Select the 4-Circle Venn Diagram Template. It will automatically load on your board.
Step 2: Customize your Venn diagram by clicking on each circle to edit the text. Input your specific sets of data into each circle.
Step 3: To show intersections and commonalities between your data sets, drag and adjust your circles so that they overlap in the necessary areas.
Step 4: Invite team members to collaborate by sharing the board with them. They can join in real-time to add comments, feedback, and ideas directly onto the Venn diagram.
Remember, with Miro, all changes are automatically saved, so you can return and change your diagram anytime. Enjoy creating a visual representation of your data that's both clear and engaging.
Miro is the perfect Venn diagram maker with a range of available templates and the ability to customize everything, from the number of circles to labeling and colors. Create professional Venn diagrams that will help you explain complex topics with confidence.
Can I customize the 4 Circle Venn Diagram Template in Miro?
Absolutely! Miro's templates are fully customizable. You can change your circles' colors, sizes, fonts, and arrangement. This allows for a truly tailored and personalized visualization experience.
Can multiple team members work on the Venn diagram simultaneously?
Yes, Miro's platform supports real-time collaboration. This means multiple team members can work on the Venn diagram simultaneously, making it perfect for brainstorming sessions or collaborative meetings.
Can I save and share my 4 Circle Venn Diagram?
Yes, you can easily save your work on your Miro board. To share it with others, simply use the share button to generate a link, or export your diagram as an image or PDF.
How can I use the 4 Circle Venn Diagram in a presentation?
Miro's 4 Circle Venn Diagram Template can easily be integrated into presentations. Use the frame tool to create a slide with your Venn Diagram, then present directly from Miro or export your frame as an image to insert into a presentation deck.
Get started with this template right now.
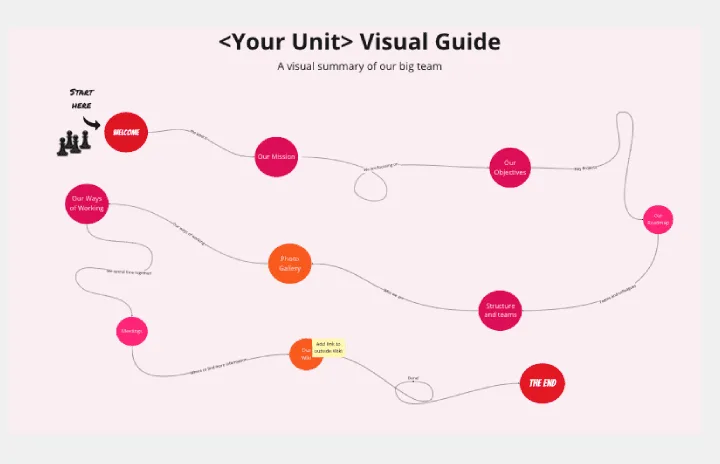
Org Unit Visual Guide
Works best for:
Org Charts, Operations, Mapping
Org Unit Visual Guide template offers a visual reference for understanding organizational units and their relationships. By mapping out departments, teams, and reporting lines, this template enhances clarity and transparency. With customizable features for adding annotations and descriptions, this template facilitates communication and alignment across organizational units.
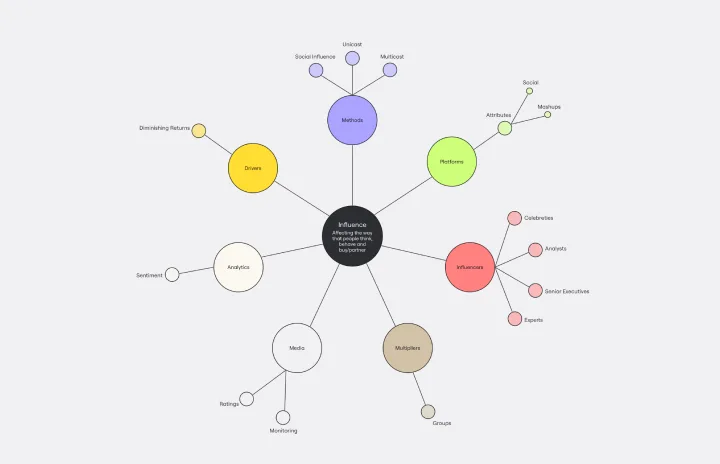
Cluster Diagram Template
Works best for:
Diagramming
The Cluster Diagram Template is a valuable tool for organizing and connecting ideas, concepts, and information in a visually compelling and coherent manner. The template's design centers on grouping related ideas around a core concept, creating a transparent and hierarchical structure. This clustering not only aids in breaking down complex information into manageable segments but also significantly enhances the process of idea generation and brainstorming. A structured yet flexible visual framework encourages deeper engagement and more precise understanding, making it an essential asset for teams and people looking to bring order to their creative and analytical processes. I have checked the text for any potential spelling, grammar, and punctuation errors, and it's good to go.
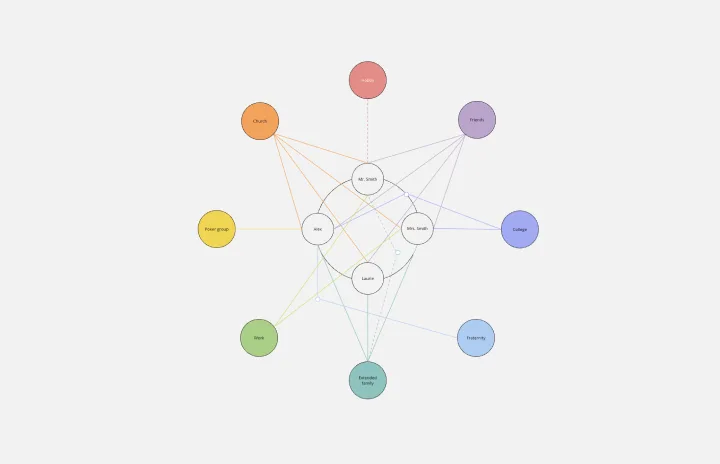
Ecomap Template
Works best for:
Strategy & Planning, Diagramming
The Ecomap Template illustrates the multifaceted relationships and environmental interactions encircling an individual or entity. Determine crucial patterns and dynamics by providing a clear and comprehensive visualization of how different systems intertwine and influence each other.
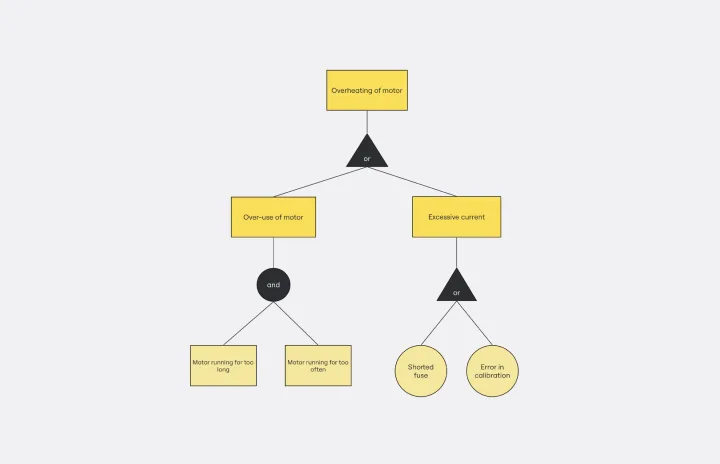
Fault Tree Analysis Template
Works best for:
Diagramming
The Fault Tree Analysis Template visually breaks down potential system malfunctions, highlighting complex causal relationships between faults. One of its standout benefits is its ability to enhance clarity in complex scenarios, allowing professionals to swiftly pinpoint root causes and prioritize interventions, ensuring a more streamlined approach to problem-solving.
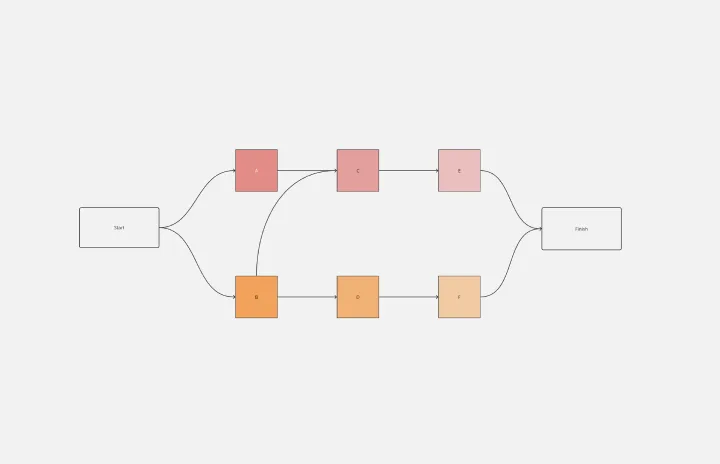
Precedence Diagram
Works best for:
Diagramming, Mapping
The Precedence Diagram Template offers a visual tool that maps out project activities and their interrelated sequences. This diagram empowers teams to recognize and anticipate workflow structures by illustrating the connections and dependencies among tasks.
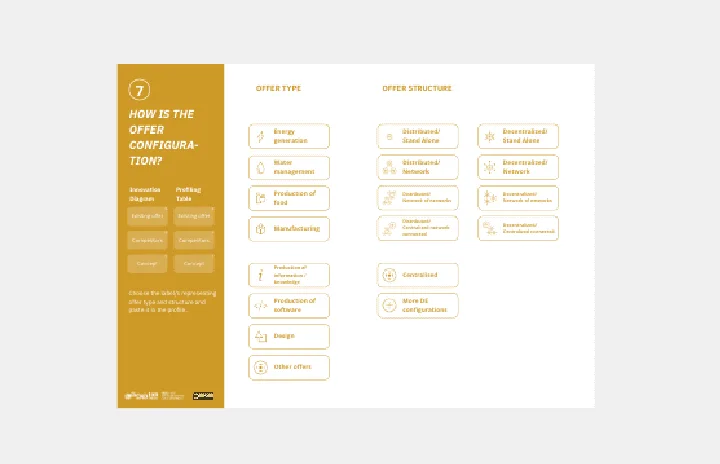
Innovation Diagram_S.PSS
Works best for:
Diagramming
The Innovation Diagram_S.PSS template offers a visual framework for mapping out the innovation process using the S.PSS (Service Product System Strategy) approach. It provides elements for defining service components, product features, and system interactions. This template enables teams to visualize and communicate their innovation strategy, facilitating alignment and collaboration across stakeholders. By promoting systematic innovation and holistic thinking, the Innovation Diagram_S.PSS empowers organizations to drive sustainable growth and competitive advantage through service and product innovation.