Use Case Diagram Template
Illustrate examples of interactions between personas and use cases with a use case diagram template.
Trusted by 65M+ users and leading companies


About the Use Case Diagram Template
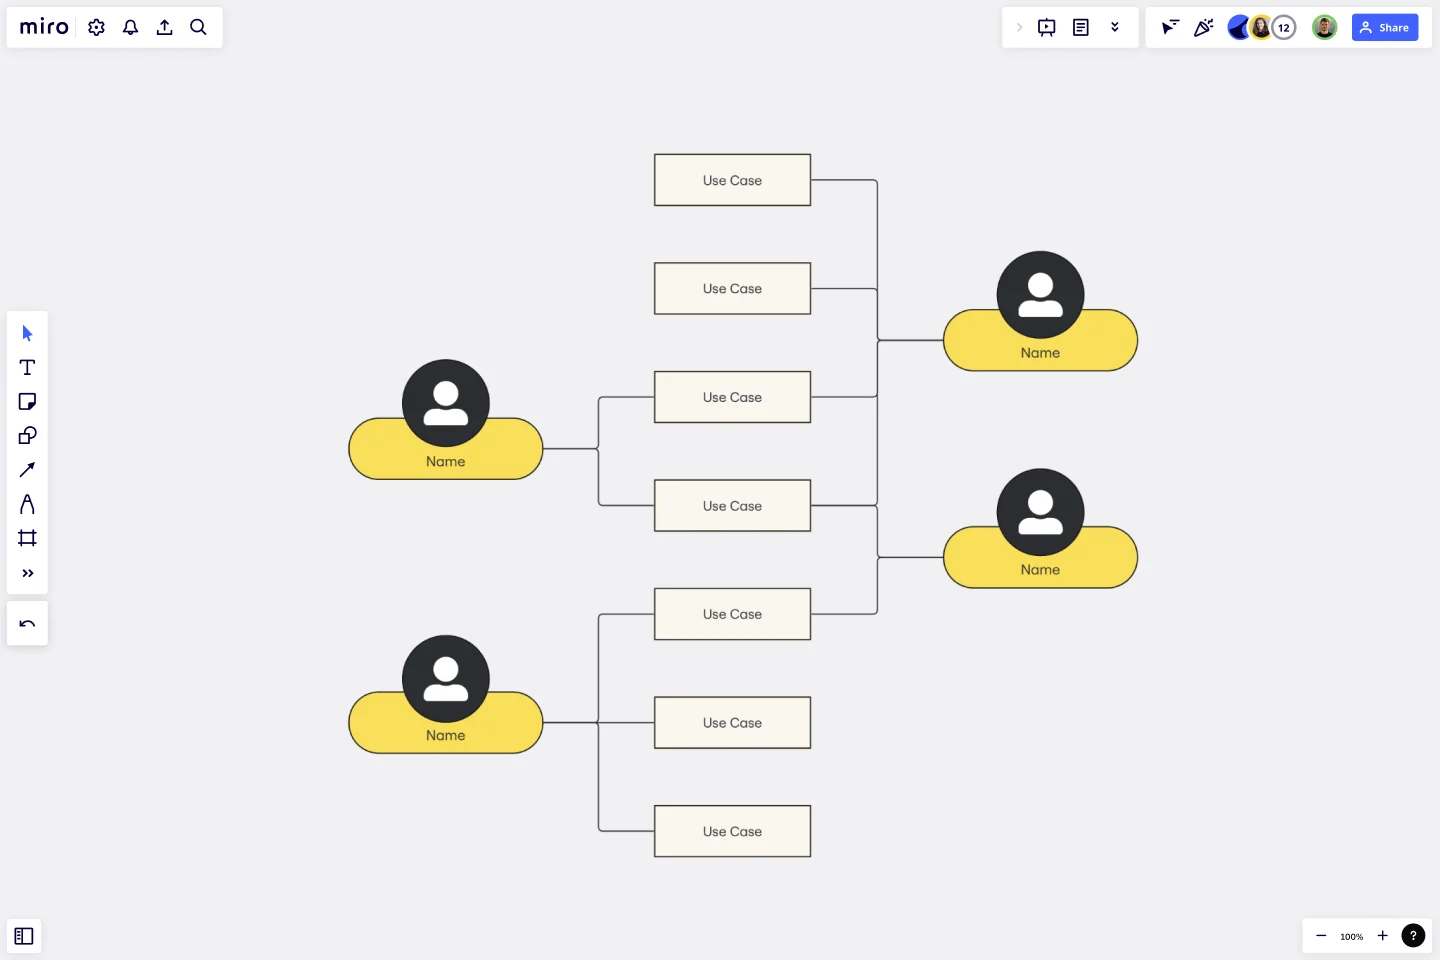
Miro’s use case diagram template is a visual tool that helps you analyze system relationships between personas and use cases — allowing your team to quickly illustrate system functionality.
These diagrams typically depict a system’s expected behavior, such as what will happen and when. It’s especially helpful because it allows you to design a system from the end user's perspective. In other words, it’s a powerful tool for communicating your desired system behavior in the language of the user by specifying all externally visible system behavior.
Generally, use case diagrams are not very detailed. They contain just the essential information that helps represent the goals of system-user interactions, define and organize the functional requirements in a system, specify the context and requirements of a system, and model the basic flow of events in a use case.
How to fill in the use case diagram template?
Creating and sharing your team’s own use case diagram is easy using Miro. Start by clicking on the blue “use template” button to open the use case diagram template in Miro, then follow these steps:
1. Identify your actors
Actors are anybody interacting with your system. An actor can be a customer, user, person, system, or organization. To add them to the use case diagram template, double-click on the text boxes labeled “name” to replace the content with your own.
2. Identify use cases
A good rule of thumb is to start by asking what actors need from the system. For example, at a library, actors need to pick up books, return books, get a library card, reserve rooms, and use the internet. These are all types of use cases. Once you know what yours are, double-click on the text boxes labeled “use case” to replace the pre-written content with your own.
3. Identify generalizations
Are there any associated actors who trigger similar use cases unique to them? Generalize that particular actor. A common example is the “make a payment” use case in a payment system, which generalizes three similar use cases such as “pay by debit card,” “pay by cash,” and “pay by credit card.”
4. Connect actors and use cases
Use the connection lines on the use case diagram template to represent the interactions between actors and use cases. Click and drag them to adjust where they link to — and duplicate or remove them as needed.
Want to try creating your diagram from scratch? Explore Miro's use case diagram tool and its extensive UML shape pack.
Is Miro’s use case template free?
Yes, Miro’s use case diagram template is free and ready to use — allowing you to start filling it in, customizing it, and sharing it with your teammates. Want to make use of our UML shape pack? You’ll need a Business, Enterprise, or Education plan.
When to use the use case diagram template?
The use case diagram template comes in especially handy when you’re not looking to build your own diagram from scratch — allowing you to save time and start visualizing how your system or application interacts with people, systems, or organizations. You can also use the use case diagram template to represent and discuss the goals that users (or “actors”) achieve with the help of your system or application.
What are the benefits of a use case diagram template?
Use case diagrams are effective and malleable tools. They can help your team communicate and analyze the scope of your system; any scenario in which your system interacts with customers, organizations, external systems, or problems your applications help your customers solve. Draw a use case diagram anytime you need to specify context and requirements for a system to operate or model the flow of events in a given use case.
Get started with this template right now.

Azure Architecture Diagram Template
Works best for:
Software Development, Diagrams
The Azure Architecture Diagram Template is a diagram that will help you visualize the combination of any data and build and deploy custom machine learning models at scale. Azure is Microsoft’s cloud computing platform, designed to provide cloud-based services such as remote storage, database hosting, and centralized account management. Use Azure Architecture Diagram template to build sophisticated, transformational apps.
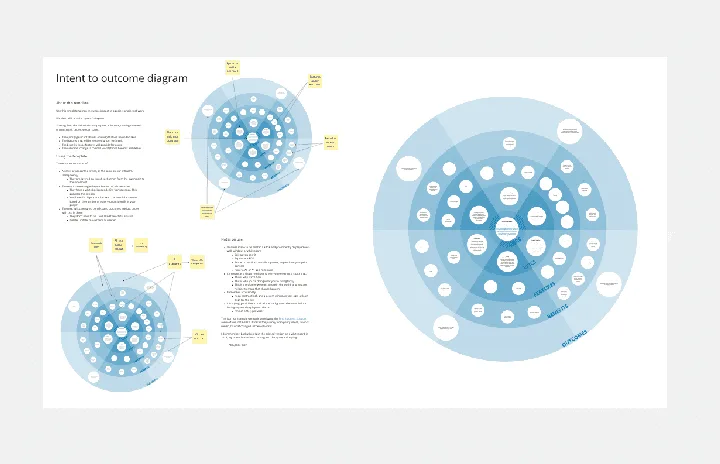
Intent to Outcome Diagram
Works best for:
Diagramming
The Intent to Outcome Diagram template is a visual tool for mapping out the relationship between desired outcomes and the actions required to achieve them. It provides a structured framework for defining intentions, outcomes, and key activities. This template enables teams to align on goals, track progress, and identify areas for improvement. By promoting clarity and alignment, the Intent to Outcome Diagram empowers organizations to set strategic direction and drive results effectively.
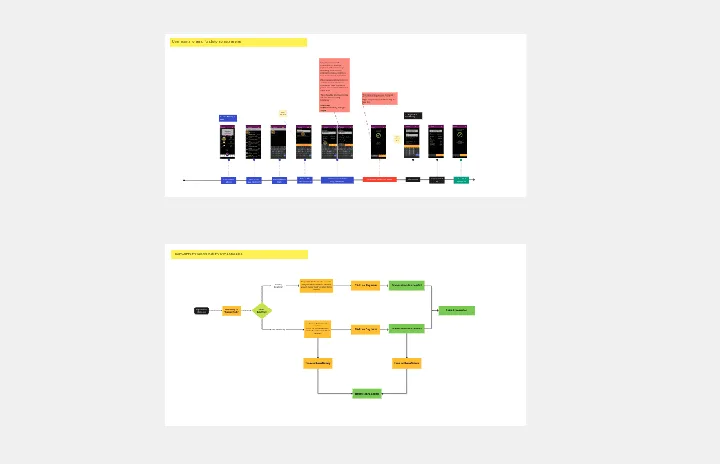
Bank Mobile App User Journey
Works best for:
Diagramming
The Bank Mobile App User Journey template offers a visual framework for mapping out the user experience journey within a banking mobile application. It provides elements for visualizing user interactions, touchpoints, and emotions throughout the journey. This template enables teams to understand user needs, pain points, and opportunities for improvement, facilitating the design of user-friendly and intuitive banking apps. By promoting empathy and user-centric design, the Bank Mobile App User Journey template empowers teams to create digital experiences that meet customer expectations and drive engagement.
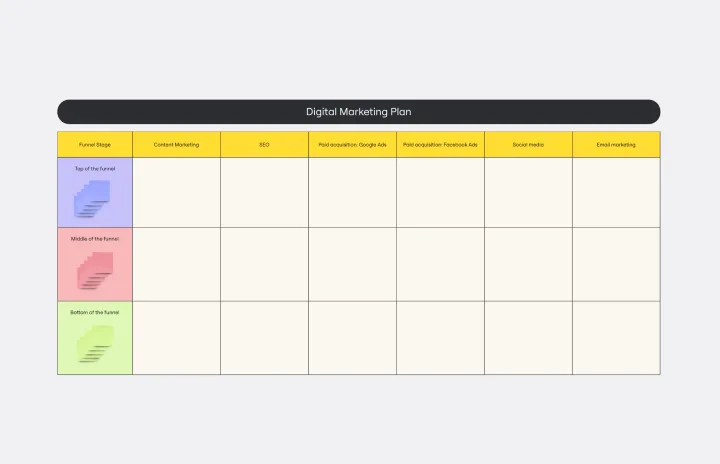
Digital Marketing Plan Template
Works best for:
Strategy, Planning, Marketing
Crafting an effective digital marketing strategy can be a daunting task, but the Digital Marketing Plan Template can make it easier for you. This tool allows you to map out every channel tactic and is particularly beneficial in fostering collaboration among team members in a centralized space. The template's clear structure and intuitive editing features ensure a well-defined digital marketing strategy while also encouraging real-time collaboration. With the ability to seamlessly collaborate, share insights, and collectively contribute, your team can create a dynamic and successful digital marketing plan.
Infographic Template
Works best for:
Marketing, Desk Research, Documentation
As we bet you’ve experienced, data can get pretty dense and dry. But you need it to be compelling, memorable, and understandable. The solution? Infographics. These are tools that let you present information in a visually striking way and turn quantitative or qualitative data into stories that engage and resonate. Whoever you’ll be presenting to — customers, donors, or your own internal teams — our template will let you design an infographic that combines text and visuals to break down even the most complicated data.

Onion Diagram Template
Works best for:
Diagramming, Mapping and Diagramming
The Onion Diagram Template is a distinct tool designed to visually represent layers of a specific concept, system, or process, akin to the layers of an onion. Each concentric layer of the diagram provides insights into a different aspect or phase of the topic at hand, moving from the core foundational element outwards to more peripheral components. One of the prime benefits of this template is its ability to offer hierarchical clarity. Users can immediately discern the importance, sequence, or interrelation of different elements within a system, facilitating enhanced comprehension and efficient decision-making.