Entity Relationship Diagram Template
Understand how the elements of your database interact with each other by using our entity relationship diagram (ERD) template.
Trusted by 65M+ users and leading companies


About the Entity Relationship Diagram (ERD) Template
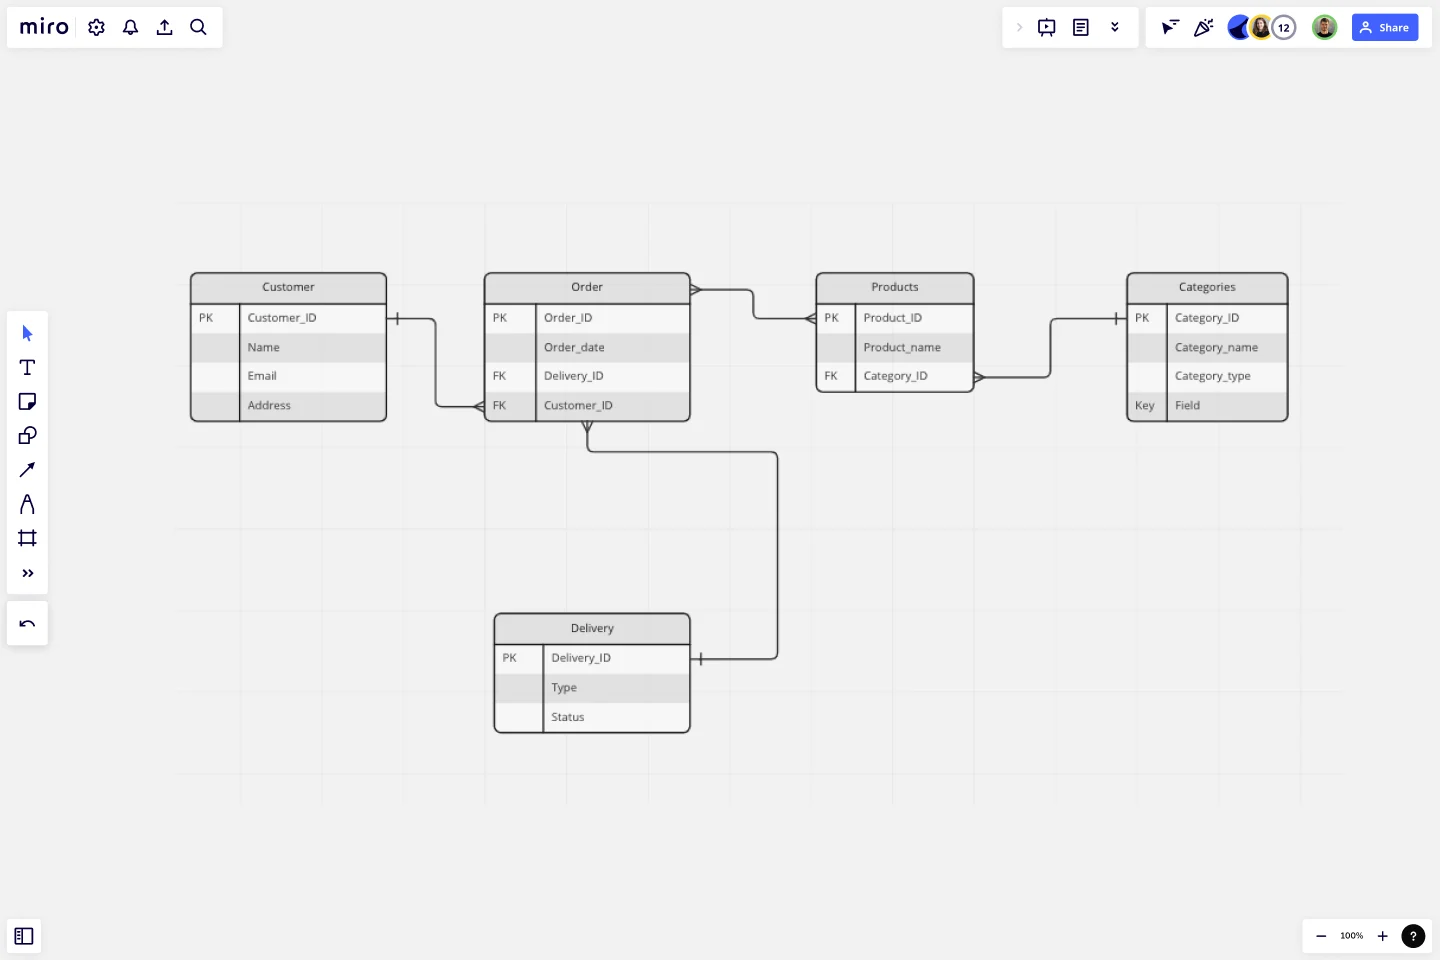
Explaining the ins and outs of a complex system is no easy feat — especially when you need to communicate with teammates, clients, or stakeholders. That’s where an entity relationship diagram (ERD) template can help. An ERD is a diagram that outlines how entities relate to each other within a complex system. Some examples include illustrating how information flows within a complex database design or depicting the different stages of a product delivery process.
In other words, an ERD helps you and your team better understand important yet complex concepts by presenting them in more digestible ways. And Miro’s ERD template allows you to kickstart the process of creating one.
How to use the entity relationship diagram (ERD) template
Ready to create an ER diagram? Scroll to the top of this page and click on the blue “Use template” button. That’ll take you straight to the template in Miro, allowing you to start editing it and making it your own. Once you’re there, here are four tips to make the most of the ERD template:
Step 1: Identify all entities in the system
An entity is anything that you can define, such as a person, concept, or object. Start by identifying what these are in your system and outlining them in the diagram. In the template, you’ll see five entities: customer, order, products, categories, and deliveries. To replace the existing text with your own, simply double-click to edit. Once you’ve identified all your entities, use the additional text boxes in each rectangle to add any supporting information.
Step 2: Identify relationships between entities
On the template, the connection lines between entities represent the relationships between them. To rearrange them, click on a connection line to reveal blue dots on each end of the line. Click on one of these dots and drag the end of the connection line to the entity you want it to lead to.
To add more connection lines, click on an entity to reveal blue dots around the rectangle, and click on one where you’d like to add a new line. You can also delete connection lines by clicking on them and hitting “Delete” on your keyboard.
Step 3: Customize your diagram
Time to truly make the ERD template your own. Add shapes, change colors, edit text, and use sticky notes to customize the overall look and feel. This step is especially helpful if you’d like your ER diagram to reflect your own brand style and colors. With Miro’s template, you can also upload your own files (such as documents and images) to further personalize and enhance your ER diagram.
Step 4: Share it with your team
Invite teammates to view your Miro board and leave comments by clicking on the blue “Share” button on the top right of your Miro board. Alternatively, you can also export your ER diagram as a PDF, image, and CSV.
Benefits of using an entity relationship diagram (ERD) template
There are various advantages to using Miro’s ER diagram template. On top of saving time from having to build one from scratch, you don’t have to create your diagram alone. Invite multiple collaborators to fill the ERD template with you in real time, or share it with them when you’re ready by inviting them to view it and leave comments.
And you’re not limited to using the pre-made shapes in the template. Miro makes it easy for you to add and remove elements from your template and even drag and drop your own files straight onto your Miro board. In other words, Miro’s ERD template makes it easy for anyone to create an ER diagram — even if they’re not familiar with the tool.
If you'd prefer to start from scratch when it comes to visualizing your database or system, Miro's diagramming capabilities make it the perfect ER diagram maker.
Who should use the ERD template?
ER diagrams are powerful visual tools for representing complex systems and illustrating the various relationships within them. Professions that could benefit from using the ERD template include software engineers, system architects, database designers and developers, business analysts, and project managers.
Why do I need an ER diagram tool?
Using an ERD tool like Miro can help you design a clear and visually appealing diagram while making it easy to collaborate and communicate with teammates. Miro’s real-time collaboration features enable you to invite people to design your ER diagram together with you at the same time, even if you aren’t in the same room.
Can I export my ERD template to other formats like PNG and PDF?
Yes, when you’ve completed your ERD template, you can easily export it as an image or PDF file. Simply head toward the top left of your Miro board, click on the button labeled “Export this board,” and choose the export option that best suits your needs.
Get started with this template right now.
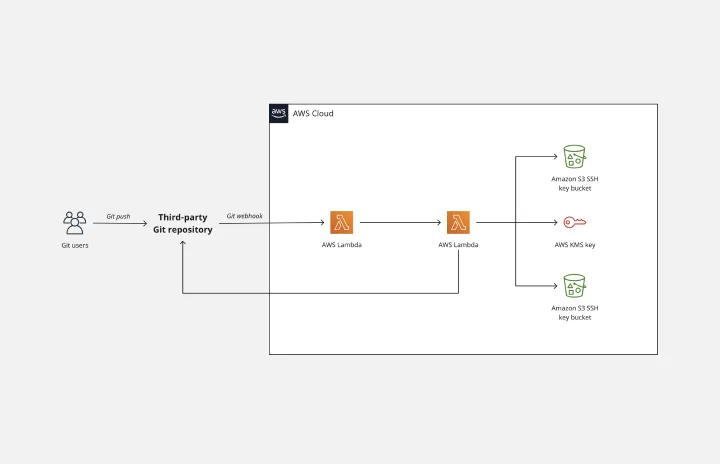
AWS Git to S3 Webhooks Template
Works best for:
Software Development, Diagrams
The AWS Git to S3 Webhooks Template is a visual representation of Git webhooks with AWS services Quick Start architecture. You can now have an overview of your AWS architecture with Miro’s AWS Git to S3 Webhooks Template, track your cloud solutions easily, and optimize processes like never before.
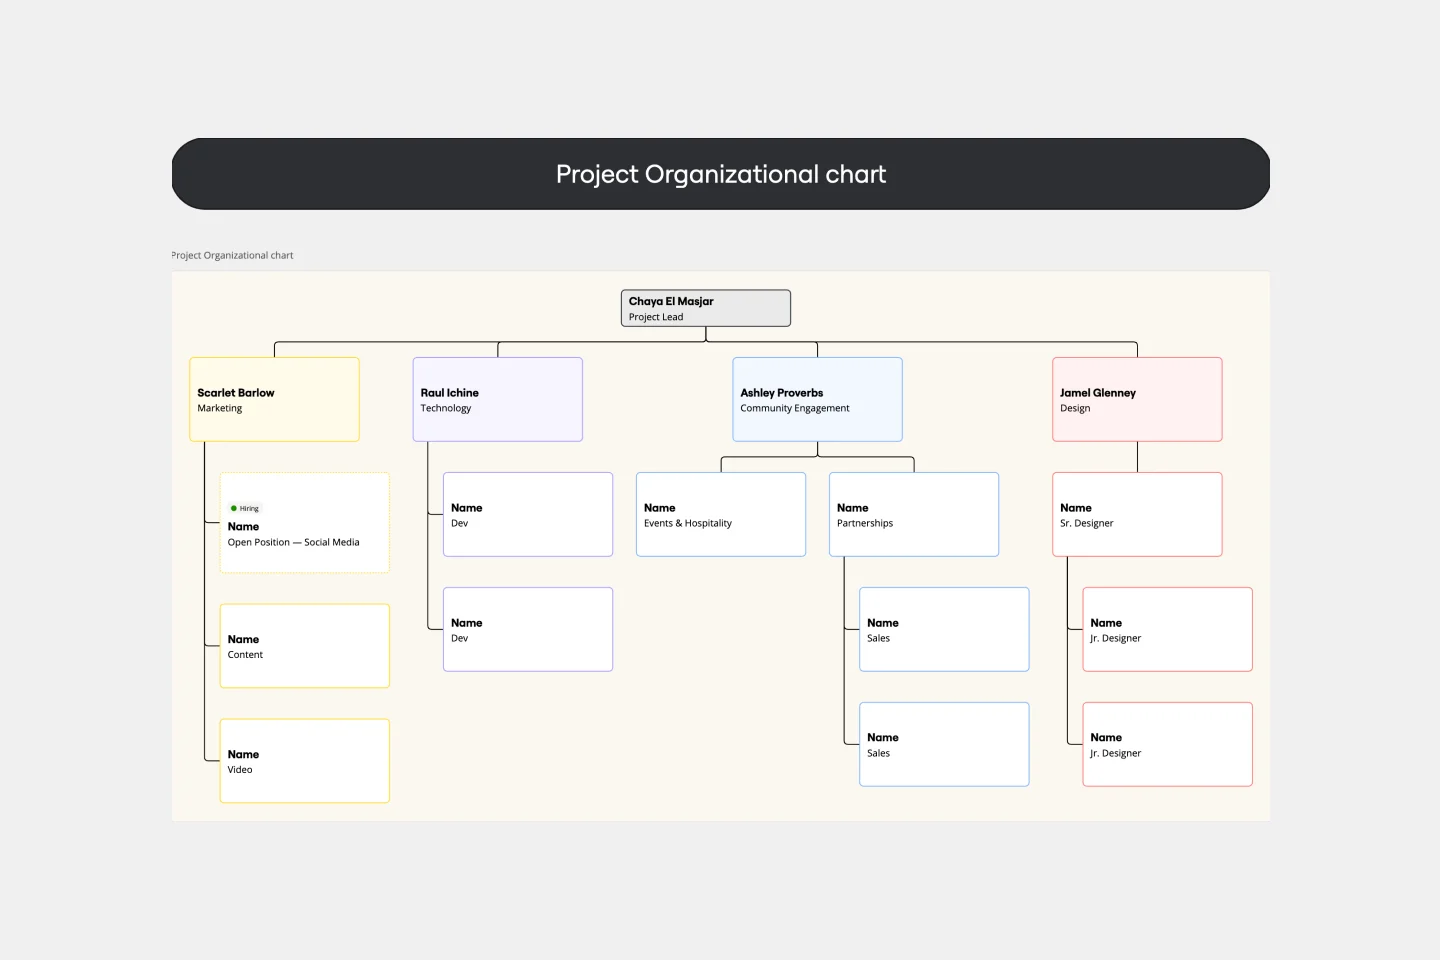
Project Organizational Chart Template
Works best for:
Project Management, Documentation, Org Charts
When you’re embarking on a long, complex project, you will inevitably hit roadblocks and obstacles. It’s important to have your project organizational chart on hand to overcome those challenges. A project organizational chart is a visual diagram that illustrates who is on your team and the role they play in a given project. It documents the structure of the project organization, the hierarchy between team members, and the relationships between employees. Project organizational charts are useful tools for clarifying who does what, securing buy-in, and setting expectations for the group.
Epic & Feature Roadmap Planning
Epic & Feature Roadmap Planning template facilitates the breakdown of large-scale initiatives into manageable features and tasks. It helps teams prioritize development efforts based on business impact and strategic objectives. By visualizing the relationship between epics and features, teams can effectively plan releases and ensure alignment with overall project goals and timelines.
Mitch Lacey's Estimation Game Template
Works best for:
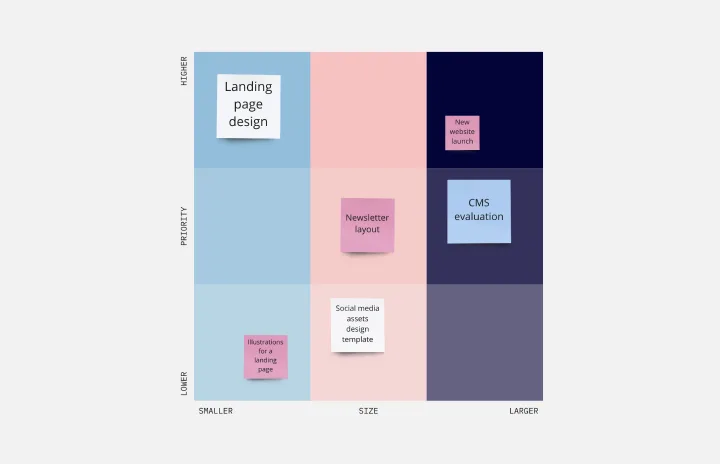
Leadership, Agile Methodology, Prioritization
A wordy name but a simple tool, Mitch Lacey’s Estimation Game is an effective way to rank your work tasks by size and priority — so you can decide what to tackle first. In the game, notecards represent your work items and feature ROI, business value, or other important metrics. You’ll place each in a quadrant (ranking them by size and priority) to help you order them in your upcoming schedule. The game also empowers developers and product management teams to work together and collaborate effectively.
Creative Brief Template
Works best for:
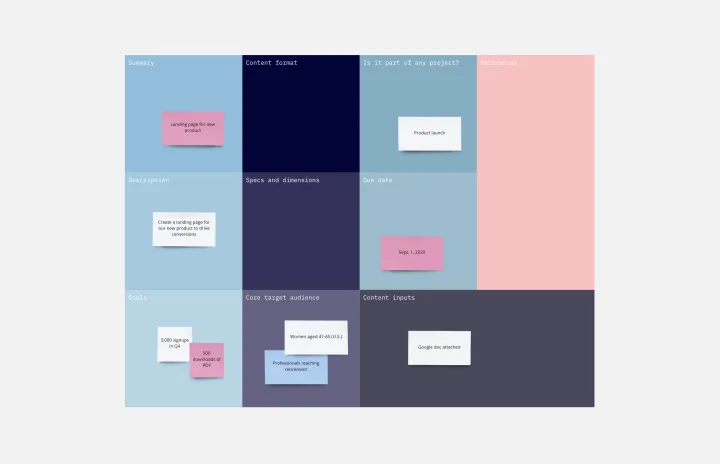
Design, Marketing, Desk Research
Even creative thinkers (or maybe especially creative thinkers) need clear guidelines to push their ideas in productive, usable directions. And a good creative lays down those guidelines, with information that includes target audience, goals, timeline, and budget, as well as the scope and specifications of the project itself. The foundation of any marketing or advertising campaign, a creative brief is the first step in building websites, videos, ads, banners, and much more. The brief is generally prepared before kicking off a project, and this template will make it easy.
Affinity Diagram Template
Works best for:
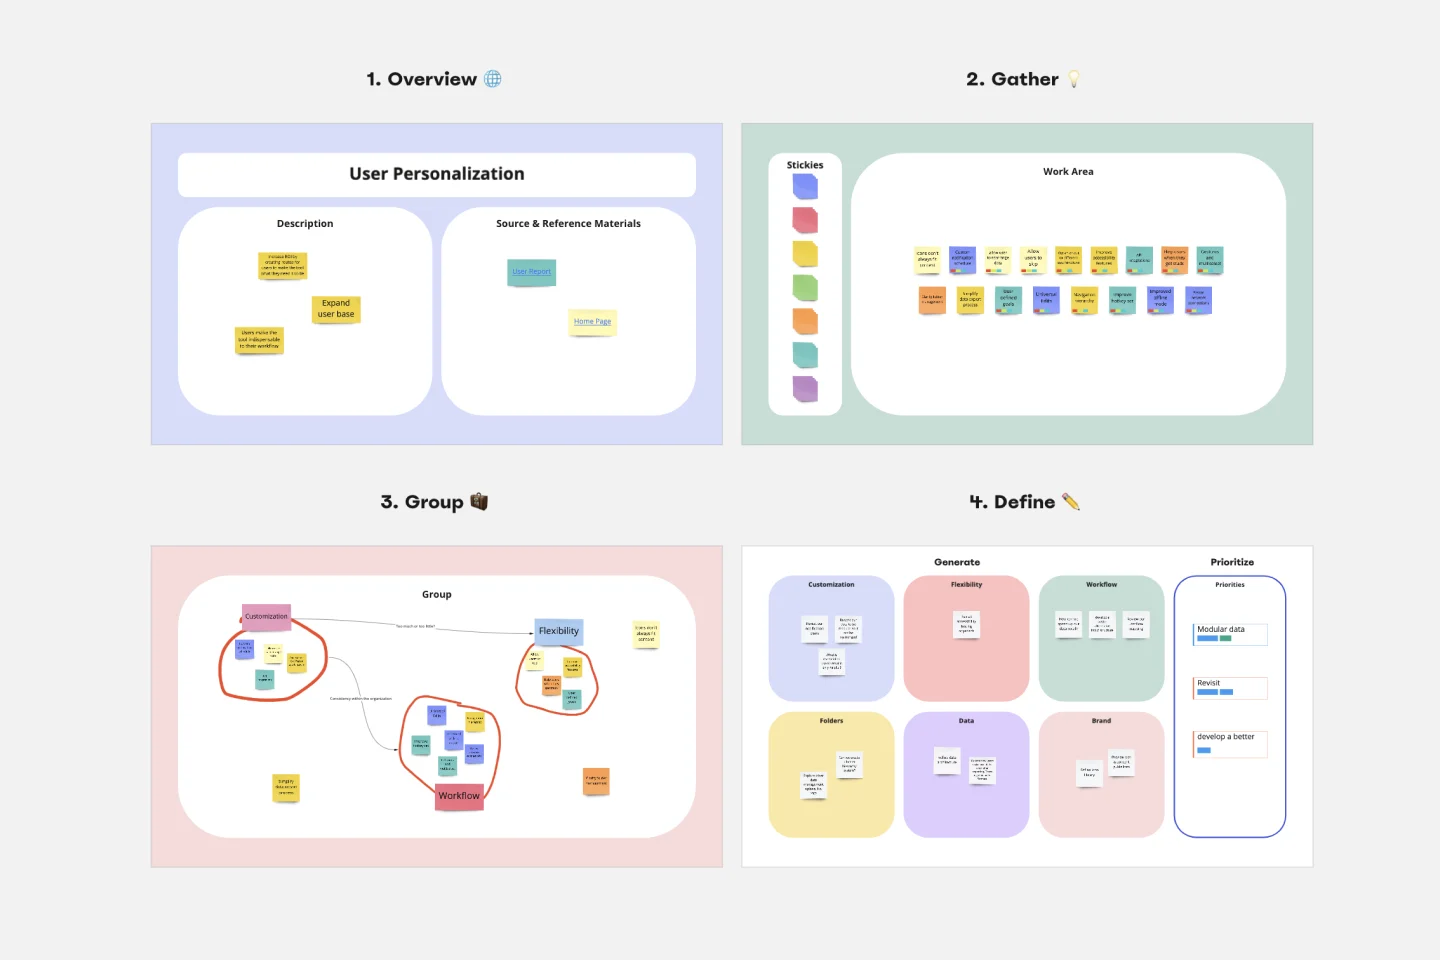
Desk Research, Mapping, Product Management
You can use an affinity diagram to generate, organize, and consolidate information that comes out of a brainstorming session. Whether you’re building a product, working through a complex problem, establishing a process, or piecing apart an issue, an affinity diagram is a useful and simple framework that gives each team member the opportunity to pitch in and share their thoughts. But it’s not just ideal for brainstorms—this is a great template and tool when you need to reach consensus or analyze data such as survey results.